
Seller's Agent in 2025
James Katz
WYND REALTY LLC
(305) 932-5289
1 in this area
5 Total Sales
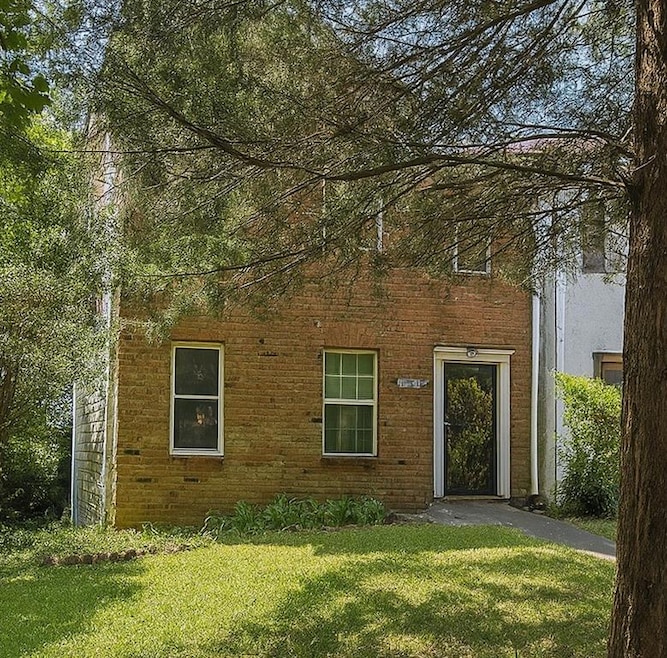
Opportunity knocks with this 3-bedroom, 2.5-bath townhome in a quiet Marietta community. Built in 1984, this diamond in the rough is priced with potential in mind — bring your vision and add instant value with just a bit of TLC. The main level features a cozy living area with fireplace, a functional kitchen with newer appliances, and access to a newly built, covered wood deck — perfect for relaxing or entertaining. All bedrooms are located upstairs, offering privacy and separation from the main living space. The unfinished basement is ideal for a workshop, home gym, or extra storage. Whether you're an investor or first-time buyer ready to make it your own, this one’s worth a look. Priced to sell!
| Date | Type | Sale Price | Title Company |
|---|---|---|---|
| Special Warranty Deed | $244,000 | Terrallova Title & Escrow | |
| Warranty Deed | -- | -- | |
| Deed | $134,500 | -- | |
| Deed | $115,000 | -- |
| Date | Status | Loan Amount | Loan Type |
|---|---|---|---|
| Open | $183,000 | New Conventional | |
| Previous Owner | $118,375 | FHA | |
| Previous Owner | $132,354 | FHA | |
| Previous Owner | $79,050 | New Conventional |
| Date | Event | Price | List to Sale | Price per Sq Ft |
|---|---|---|---|---|
| 08/12/2025 08/12/25 | Sold | $244,000 | -2.4% | $171 / Sq Ft |
| 07/12/2025 07/12/25 | Pending | -- | -- | -- |
| 07/03/2025 07/03/25 | For Sale | $249,999 | -- | $175 / Sq Ft |
| Year | Tax Paid | Tax Assessment Tax Assessment Total Assessment is a certain percentage of the fair market value that is determined by local assessors to be the total taxable value of land and additions on the property. | Land | Improvement |
|---|---|---|---|---|
| 2025 | $712 | $115,204 | $18,000 | $97,204 |
| 2024 | $714 | $115,204 | $18,000 | $97,204 |
| 2023 | $454 | $97,224 | $18,000 | $79,224 |
| 2022 | $645 | $92,140 | $13,200 | $78,940 |
| 2021 | $583 | $71,192 | $13,200 | $57,992 |
| 2020 | $547 | $59,156 | $11,200 | $47,956 |
| 2019 | $530 | $53,712 | $7,200 | $46,512 |
| 2018 | $1,630 | $53,712 | $7,200 | $46,512 |
| 2017 | $992 | $34,496 | $7,200 | $27,296 |
| 2016 | $736 | $34,496 | $7,200 | $27,296 |
| 2015 | $653 | $30,996 | $6,000 | $24,996 |
| 2014 | $371 | $21,308 | $0 | $0 |
Seller's Agent in 2025
James Katz
WYND REALTY LLC
(305) 932-5289
1 in this area
5 Total Sales
Seller Co-Listing Agent in 2025
Anton Vanas
WYND REALTY LLC
(240) 252-9111
1 in this area
107 Total Sales
Buyer's Agent in 2025
Anne Tamm
Anne Tamm, LLC.
(404) 247-5257
9 in this area
120 Total Sales
Source: First Multiple Listing Service (FMLS)
MLS Number: 7610945
APN: 16-1025-0-036-0
Disclaimer: Certain information contained herein is derived from information provided by parties other than Homes.com. All information provided is deemed reliable, but is not guaranteed to be accurate and should be independently verified.
![]() Listings identified with the FMLS IDX logo come from FMLS and are held by brokerage firms other than the owner of this website. The listing brokerage is identified in any listing details. Information is deemed reliable but is not guaranteed. If you believe any FMLS listing contains material that infringes your copyrighted work please visit www.fmls.com/dmca to review our DMCA policy and learn how to submit a takedown request. © 2025 First Multiple Listing Service, Inc.
Listings identified with the FMLS IDX logo come from FMLS and are held by brokerage firms other than the owner of this website. The listing brokerage is identified in any listing details. Information is deemed reliable but is not guaranteed. If you believe any FMLS listing contains material that infringes your copyrighted work please visit www.fmls.com/dmca to review our DMCA policy and learn how to submit a takedown request. © 2025 First Multiple Listing Service, Inc.