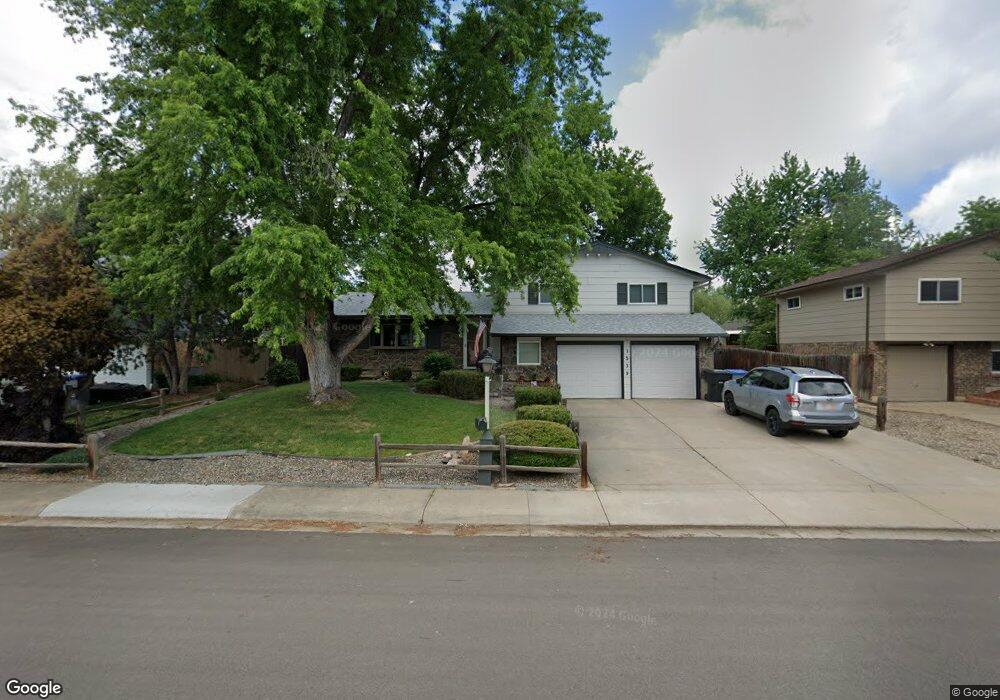
1539 Chapman Ln Longmont, CO 80501
Southmoor NeighborhoodEstimated Value: $488,867 - $530,000
3
Beds
3
Baths
1,278
Sq Ft
$399/Sq Ft
Est. Value
About This Home
This home is located at 1539 Chapman Ln, Longmont, CO 80501 and is currently estimated at $510,467, approximately $399 per square foot. 1539 Chapman Ln is a home located in Boulder County with nearby schools including Indian Peaks Elementary School, Sunset Middle School, and Niwot High School.
Ownership History
Date
Name
Owned For
Owner Type
Purchase Details
Closed on
Sep 28, 1993
Sold by
Zolotar David A and Zolotar Patricia K
Bought by
Jacobs Michael F
Current Estimated Value
Home Financials for this Owner
Home Financials are based on the most recent Mortgage that was taken out on this home.
Original Mortgage
$113,400
Interest Rate
7.16%
Purchase Details
Closed on
Nov 3, 1978
Bought by
Jacobs Michael F and Jacobs Pamela S
Purchase Details
Closed on
Jan 12, 1973
Bought by
Jacobs Michael F and Jacobs Pamela S
Create a Home Valuation Report for This Property
The Home Valuation Report is an in-depth analysis detailing your home's value as well as a comparison with similar homes in the area
Home Values in the Area
Average Home Value in this Area
Purchase History
| Date | Buyer | Sale Price | Title Company |
|---|---|---|---|
| Jacobs Michael F | $126,800 | -- | |
| Jacobs Michael F | $63,500 | -- | |
| Jacobs Michael F | $28,200 | -- |
Source: Public Records
Mortgage History
| Date | Status | Borrower | Loan Amount |
|---|---|---|---|
| Closed | Jacobs Michael F | $113,400 |
Source: Public Records
Tax History Compared to Growth
Tax History
| Year | Tax Paid | Tax Assessment Tax Assessment Total Assessment is a certain percentage of the fair market value that is determined by local assessors to be the total taxable value of land and additions on the property. | Land | Improvement |
|---|---|---|---|---|
| 2025 | $2,155 | $30,238 | $11,713 | $18,525 |
| 2024 | $2,155 | $30,238 | $11,713 | $18,525 |
| 2023 | $2,126 | $29,232 | $14,619 | $18,298 |
| 2022 | $1,795 | $25,090 | $10,328 | $14,762 |
| 2021 | $1,818 | $25,812 | $10,625 | $15,187 |
| 2020 | $1,588 | $23,502 | $8,580 | $14,922 |
| 2019 | $2,247 | $23,502 | $8,580 | $14,922 |
| 2018 | $1,858 | $19,562 | $5,904 | $13,658 |
| 2017 | $1,833 | $21,627 | $6,527 | $15,100 |
| 2016 | $1,694 | $17,727 | $5,890 | $11,837 |
| 2015 | $1,615 | $15,363 | $4,617 | $10,746 |
| 2014 | $1,435 | $15,363 | $4,617 | $10,746 |
Source: Public Records
Map
Nearby Homes
- 1327 Brookfield Dr
- 1435 Missouri Ave
- 1801 S Pratt Pkwy
- 1350 S Lincoln St
- 1435 Ashcroft Dr
- 1527 S Vivian St
- 1028 Katy Ln
- 2030 Emerald Dr
- 2050 Emerald Dr
- 1321 Onyx Cir
- 2119 Onyx Way
- 912 Confidence Dr
- 802 Neon Forest Cir
- 919 S Sherman St
- 1456 Sepia Ave
- 9 Seattle Ln
- 2240 Summitview Dr
- 1518 Sepia Ave
- 740 Satisfaction Cir
- 730 Satisfaction Cir
- 1545 Chapman Ln
- 1533 Chapman Ln
- 1423 Missouri Ave
- 1415 Missouri Ave
- 1421 Missouri Ave
- 1551 Chapman Ln
- 1527 Chapman Ln
- 1548 Chapman Ln
- 1542 Chapman Ln
- 1425 Missouri Ave
- 1536 Chapman Ln
- 1318 Brookfield Dr
- 1310 Brookfield Dr
- 1400 Brookfield Dr
- 1530 Chapman Ln
- 1408 Brookfield Dr
- 1427 Missouri Ave
- 1524 Chapman Ln
- 1455 S Bowen St
- 1414 Brookfield Dr