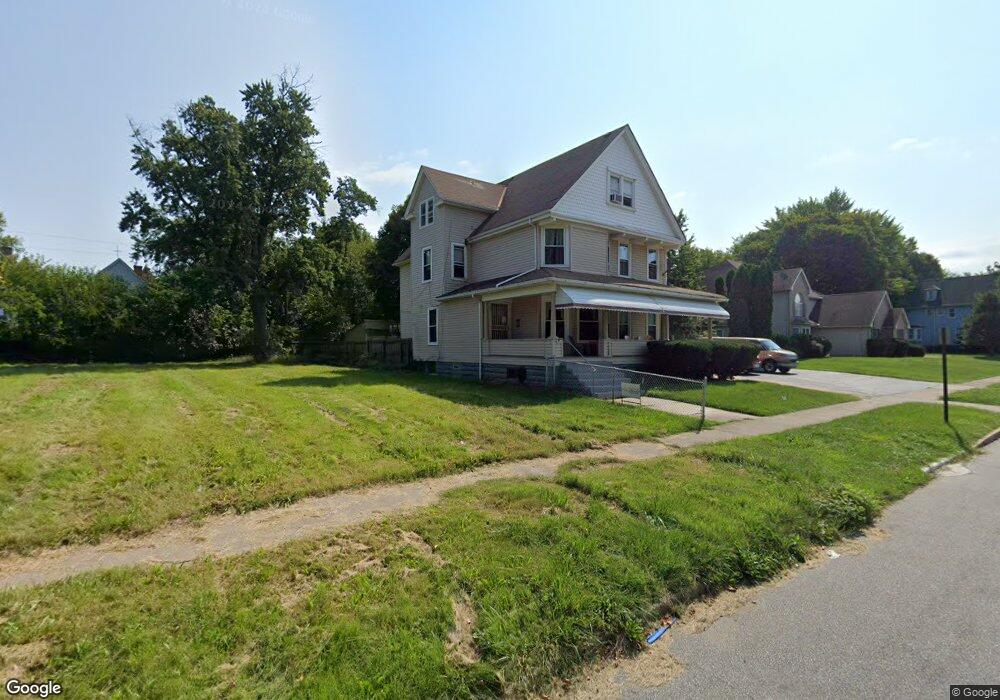
1539 E 82nd St Cleveland, OH 44103
Hough NeighborhoodEstimated Value: $109,000 - $187,000
4
Beds
1
Bath
2,741
Sq Ft
$51/Sq Ft
Est. Value
About This Home
This home is located at 1539 E 82nd St, Cleveland, OH 44103 and is currently estimated at $139,738, approximately $50 per square foot. 1539 E 82nd St is a home located in Cuyahoga County with nearby schools including Bolton, Anton Grdina School, and Andrew J. Rickoff School.
Ownership History
Date
Name
Owned For
Owner Type
Purchase Details
Closed on
Jun 11, 2019
Sold by
Cuyahoga County Land Reutilization Corp
Bought by
Hill Darnell and Gray Galica D
Current Estimated Value
Purchase Details
Closed on
Nov 8, 2001
Sold by
Small Yolanda J
Bought by
Hill Darnell
Home Financials for this Owner
Home Financials are based on the most recent Mortgage that was taken out on this home.
Original Mortgage
$104,176
Interest Rate
6.69%
Mortgage Type
FHA
Purchase Details
Closed on
Jun 13, 1995
Sold by
Escalante Evelina
Bought by
Small Yolanda J
Home Financials for this Owner
Home Financials are based on the most recent Mortgage that was taken out on this home.
Original Mortgage
$40,850
Interest Rate
8.26%
Mortgage Type
New Conventional
Purchase Details
Closed on
Jun 28, 1984
Sold by
Weaver William L
Bought by
Escalante Evelina
Purchase Details
Closed on
Apr 9, 1981
Sold by
Chaykosky Pauline
Bought by
Weaver William L
Purchase Details
Closed on
Jan 1, 1975
Bought by
Chaykosky Pauline
Create a Home Valuation Report for This Property
The Home Valuation Report is an in-depth analysis detailing your home's value as well as a comparison with similar homes in the area
Home Values in the Area
Average Home Value in this Area
Purchase History
| Date | Buyer | Sale Price | Title Company |
|---|---|---|---|
| Hill Darnell | -- | None Available | |
| Hill Darnell | $105,000 | Executive Title Agency Corp | |
| Small Yolanda J | $43,000 | -- | |
| Escalante Evelina | $14,000 | -- | |
| Weaver William L | $14,000 | -- | |
| Chaykosky Pauline | -- | -- |
Source: Public Records
Mortgage History
| Date | Status | Borrower | Loan Amount |
|---|---|---|---|
| Previous Owner | Hill Darnell | $104,176 | |
| Previous Owner | Small Yolanda J | $40,850 |
Source: Public Records
Tax History Compared to Growth
Tax History
| Year | Tax Paid | Tax Assessment Tax Assessment Total Assessment is a certain percentage of the fair market value that is determined by local assessors to be the total taxable value of land and additions on the property. | Land | Improvement |
|---|---|---|---|---|
| 2024 | $2,401 | $36,610 | $4,025 | $32,585 |
| 2023 | $2,228 | $29,370 | $2,240 | $27,130 |
| 2022 | $2,215 | $29,365 | $2,240 | $27,125 |
| 2021 | $2,193 | $29,370 | $2,240 | $27,130 |
| 2020 | $2,186 | $25,310 | $1,930 | $23,380 |
| 2019 | $2,021 | $72,300 | $5,500 | $66,800 |
| 2018 | $2,014 | $25,310 | $1,930 | $23,380 |
| 2017 | $1,764 | $21,390 | $2,420 | $18,970 |
| 2016 | $1,750 | $21,390 | $2,420 | $18,970 |
| 2015 | $1,673 | $21,390 | $2,420 | $18,970 |
| 2014 | $1,673 | $20,370 | $2,310 | $18,060 |
Source: Public Records
Map
Nearby Homes
- 8120 Cory Ave
- 1514 E 81st St
- 8312 Linwood Ave
- 1373 E 84th St
- 1346 E 82nd St
- 7608 Lawnview Ave
- 1332 E 84th St
- 7705 Star Ave
- 7507 Lawnview Ave
- 1694 E 90th St
- 7614 Star Ave
- 1470 E 93rd St
- 7307 Linwood Ave
- 1616 E 93rd St
- 7212 Wade Park Ave Unit 4
- 7108 Dellenbaugh Ave
- 1861 E 81st St
- 1370 E 93rd St
- 1344 E 93rd St
- 1194 E 84th St