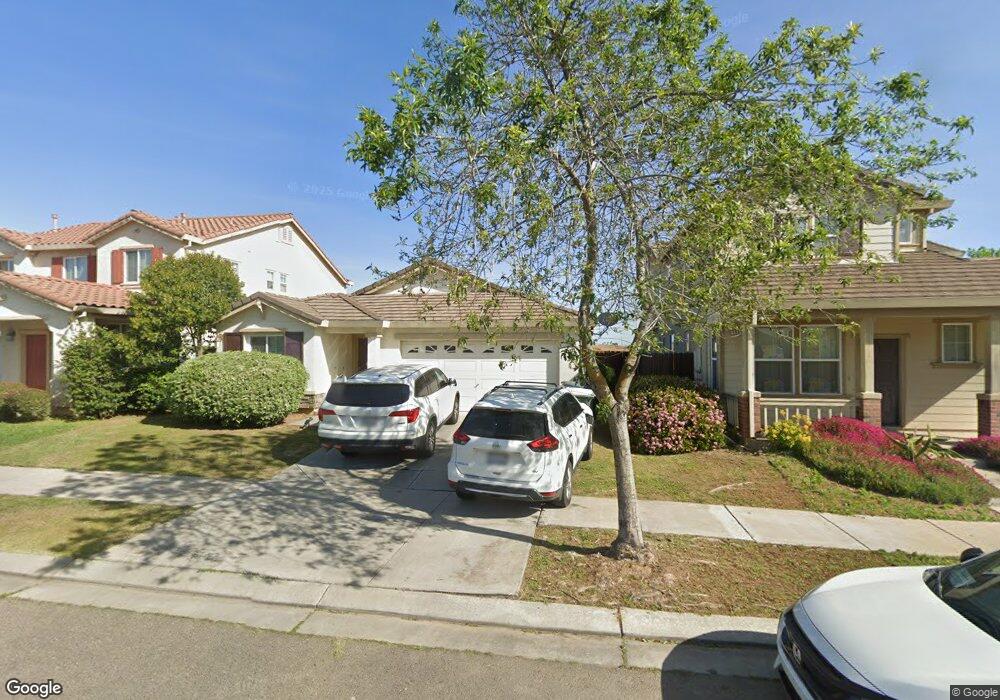
1539 La Sierra St Merced, CA 95348
Estimated Value: $329,000 - $411,606
3
Beds
2
Baths
1,603
Sq Ft
$242/Sq Ft
Est. Value
About This Home
This home is located at 1539 La Sierra St, Merced, CA 95348 and is currently estimated at $387,402, approximately $241 per square foot. 1539 La Sierra St is a home located in Merced County with nearby schools including Franklin Elementary School, Rudolph Rivera Middle School, and El Capitan High School.
Ownership History
Date
Name
Owned For
Owner Type
Purchase Details
Closed on
Jul 14, 2018
Sold by
Liu Yifeng and Qian Jin
Bought by
Qian Jin and Liu Yifeng
Current Estimated Value
Purchase Details
Closed on
Aug 30, 2011
Sold by
Esver Michael C and Santos Myra O
Bought by
Liu Yifeng and Qian Jin
Home Financials for this Owner
Home Financials are based on the most recent Mortgage that was taken out on this home.
Original Mortgage
$97,500
Outstanding Balance
$67,465
Interest Rate
4.48%
Mortgage Type
New Conventional
Estimated Equity
$319,937
Purchase Details
Closed on
Feb 11, 2007
Sold by
Esver Michael C and Esver Myra Santos
Bought by
Esver Michael C and Santos Myra O
Purchase Details
Closed on
Sep 1, 2006
Sold by
Morrison Homes Inc
Bought by
Esver Michael C and Esver Myra Santos
Home Financials for this Owner
Home Financials are based on the most recent Mortgage that was taken out on this home.
Original Mortgage
$250,084
Interest Rate
6.62%
Mortgage Type
Purchase Money Mortgage
Create a Home Valuation Report for This Property
The Home Valuation Report is an in-depth analysis detailing your home's value as well as a comparison with similar homes in the area
Home Values in the Area
Average Home Value in this Area
Purchase History
| Date | Buyer | Sale Price | Title Company |
|---|---|---|---|
| Qian Jin | -- | None Available | |
| Liu Yifeng | $130,000 | First American Title Company | |
| Esver Michael C | -- | None Available | |
| Esver Michael C | $313,000 | First American Title Co |
Source: Public Records
Mortgage History
| Date | Status | Borrower | Loan Amount |
|---|---|---|---|
| Open | Liu Yifeng | $97,500 | |
| Previous Owner | Esver Michael C | $250,084 |
Source: Public Records
Tax History Compared to Growth
Tax History
| Year | Tax Paid | Tax Assessment Tax Assessment Total Assessment is a certain percentage of the fair market value that is determined by local assessors to be the total taxable value of land and additions on the property. | Land | Improvement |
|---|---|---|---|---|
| 2025 | $2,888 | $163,274 | $13,810 | $149,464 |
| 2024 | $2,888 | $160,074 | $13,540 | $146,534 |
| 2023 | $2,830 | $156,936 | $13,275 | $143,661 |
| 2022 | $2,750 | $153,860 | $13,015 | $140,845 |
| 2021 | $2,671 | $150,844 | $12,760 | $138,084 |
| 2020 | $2,664 | $149,299 | $12,630 | $136,669 |
| 2019 | $2,617 | $146,373 | $12,383 | $133,990 |
| 2018 | $2,449 | $143,504 | $12,141 | $131,363 |
| 2017 | $2,478 | $140,691 | $11,903 | $128,788 |
| 2016 | $2,427 | $137,933 | $11,670 | $126,263 |
| 2015 | $2,387 | $135,862 | $11,495 | $124,367 |
| 2014 | $2,346 | $133,201 | $11,270 | $121,931 |
Source: Public Records
Map
Nearby Homes
- 1361 Carlsbad Dr
- 3803 Colma Ct
- 3843 Colma Ave Unit 1
- 3593 San Vincent Ave
- 1397 Esplanade Dr
- 1344 Hermosa Dr
- 1338 Hermosa Dr
- 3749 Morningside Ave
- 1293 Sunrise Dr
- 4032 Wood Creek Ct
- 3575 San Vincent Ave
- 3954 Menton Ct
- Adams Plan at Lantana
- Kennedy Plan at Lantana
- Coolidge Plan at Lantana
- Lincoln Plan at Lantana
- 1269 Lurs Ct
- 1240 Pacific Dr
- 1543 La Sierra St
- 1533 La Sierra St
- 1525 La Sierra St
- 1551 La Sierra St
- 1521 La Sierra St
- 1546 La Sierra St
- 1552 La Sierra St
- 1534 La Sierra St
- 1558 La Sierra St
- 1528 La Sierra St
- 1507 La Sierra St
- 1522 La Sierra St
- 3642 N State Highway 59
- 1512 La Sierra St
- 1504 La Sierra St
- 1491 La Sierra St
- 1496 La Sierra St
- 1488 La Sierra St
- 3622 N State Highway 59
- 1481 La Sierra St