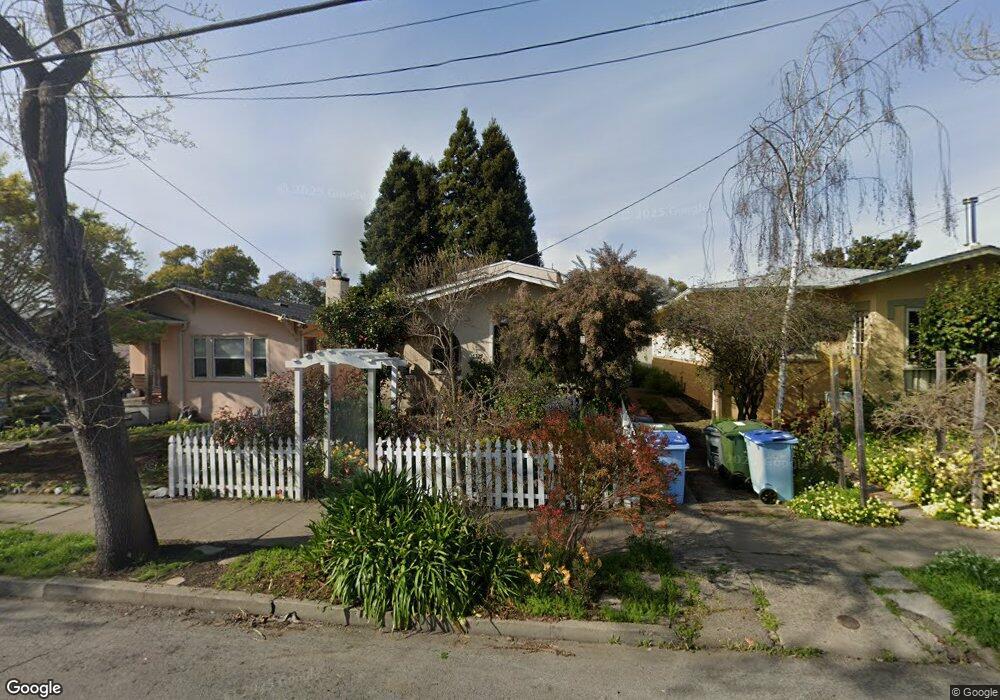
1539 Parker St Berkeley, CA 94703
South Berkeley NeighborhoodEstimated Value: $1,124,000 - $1,350,000
4
Beds
2
Baths
1,449
Sq Ft
$853/Sq Ft
Est. Value
About This Home
This home is located at 1539 Parker St, Berkeley, CA 94703 and is currently estimated at $1,236,490, approximately $853 per square foot. 1539 Parker St is a home located in Alameda County with nearby schools including Washington Elementary School, Malcolm X Elementary School, and Oxford Elementary School.
Ownership History
Date
Name
Owned For
Owner Type
Purchase Details
Closed on
May 15, 2017
Sold by
Ullman Scott H and Rothman Carol A
Bought by
Ullman Scott H and Rothman Carol A
Current Estimated Value
Purchase Details
Closed on
Apr 27, 1999
Sold by
Perkins Mark D and Machlowski Krzysztof
Bought by
Ullman Scott H and Rothman Carol A
Home Financials for this Owner
Home Financials are based on the most recent Mortgage that was taken out on this home.
Original Mortgage
$185,000
Outstanding Balance
$47,563
Interest Rate
6.98%
Estimated Equity
$1,188,927
Purchase Details
Closed on
Oct 14, 1998
Sold by
Hightower Toma
Bought by
Perkins Mark D and Machlowski Krzysztof
Home Financials for this Owner
Home Financials are based on the most recent Mortgage that was taken out on this home.
Original Mortgage
$149,223
Interest Rate
6.6%
Mortgage Type
Stand Alone First
Purchase Details
Closed on
Dec 14, 1995
Sold by
Hightower Toma
Bought by
Hightower Toma
Home Financials for this Owner
Home Financials are based on the most recent Mortgage that was taken out on this home.
Original Mortgage
$147,000
Interest Rate
7.14%
Create a Home Valuation Report for This Property
The Home Valuation Report is an in-depth analysis detailing your home's value as well as a comparison with similar homes in the area
Home Values in the Area
Average Home Value in this Area
Purchase History
| Date | Buyer | Sale Price | Title Company |
|---|---|---|---|
| Ullman Scott H | -- | None Available | |
| Ullman Scott H | $315,000 | Old Republic Title Company | |
| Perkins Mark D | $152,305 | -- | |
| Hightower Toma | -- | Chicago Title Co |
Source: Public Records
Mortgage History
| Date | Status | Borrower | Loan Amount |
|---|---|---|---|
| Open | Ullman Scott H | $185,000 | |
| Previous Owner | Perkins Mark D | $149,223 | |
| Previous Owner | Hightower Toma | $147,000 | |
| Closed | Hightower Toma | $15,000 |
Source: Public Records
Tax History
| Year | Tax Paid | Tax Assessment Tax Assessment Total Assessment is a certain percentage of the fair market value that is determined by local assessors to be the total taxable value of land and additions on the property. | Land | Improvement |
|---|---|---|---|---|
| 2025 | $8,725 | $486,800 | $148,140 | $345,660 |
| 2024 | $8,725 | $477,120 | $145,236 | $338,884 |
| 2023 | $8,529 | $474,628 | $142,388 | $332,240 |
| 2022 | $8,346 | $458,324 | $139,597 | $325,727 |
| 2021 | $8,345 | $449,201 | $136,860 | $319,341 |
| 2020 | $7,826 | $451,523 | $135,457 | $316,066 |
| 2019 | $7,440 | $442,671 | $132,801 | $309,870 |
| 2018 | $7,297 | $433,994 | $130,198 | $303,796 |
| 2017 | $7,023 | $425,485 | $127,645 | $297,840 |
| 2016 | $6,743 | $417,144 | $125,143 | $292,001 |
| 2015 | $6,645 | $410,878 | $123,263 | $287,615 |
| 2014 | $6,578 | $402,831 | $120,849 | $281,982 |
Source: Public Records
Map
Nearby Homes
- 1612 Parker St
- 1612 Carleton St
- 1515 Derby St
- 1645 Dwight Way
- 2750 Sacramento St
- 1450 Ward St
- 2758 Sacramento St
- 2727 McGee Ave
- 2774 Sacramento St
- 2782 Sacramento St
- 2790 Sacramento St
- 1530 Stuart St
- 2701 Grant St
- 1901 Parker St Unit 3
- 1535 Julia St
- 1578 Allston Way
- 1142 Dwight Way
- 2922 Stanton St
- 1118 Dwight Way
- 2324 Browning St
Your Personal Tour Guide
Ask me questions while you tour the home.