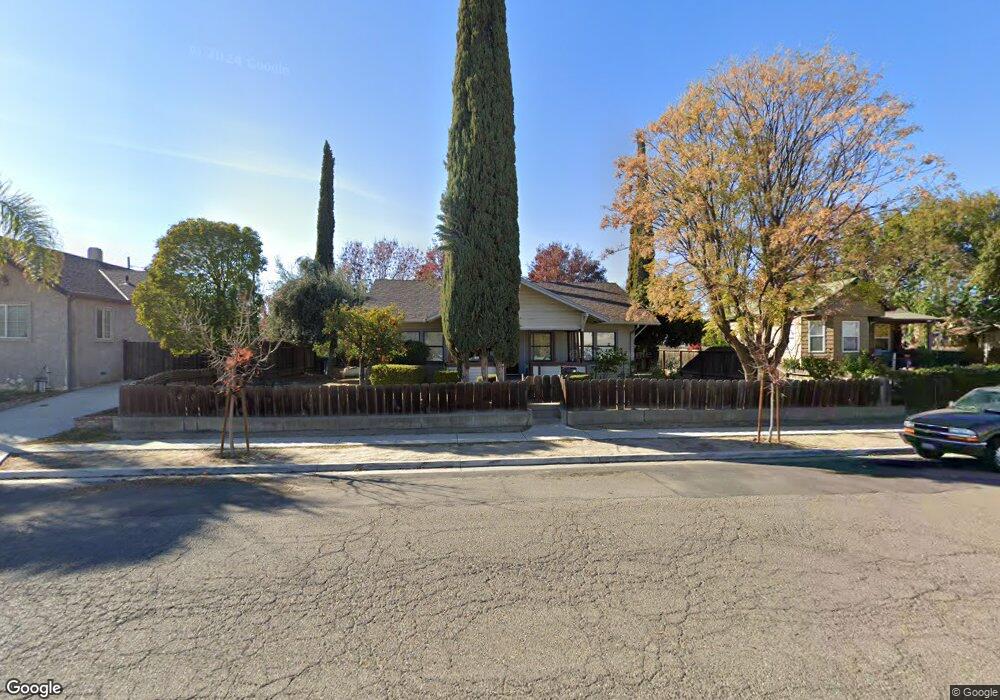
1539 Q St Newman, CA 95360
Estimated Value: $328,000 - $490,608
3
Beds
2
Baths
1,292
Sq Ft
$306/Sq Ft
Est. Value
About This Home
This home is located at 1539 Q St, Newman, CA 95360 and is currently estimated at $395,652, approximately $306 per square foot. 1539 Q St is a home located in Stanislaus County with nearby schools including Orestimba High School.
Ownership History
Date
Name
Owned For
Owner Type
Purchase Details
Closed on
Mar 9, 2024
Sold by
Garcia Jose
Bought by
Garcia Family Trust and Garcia
Current Estimated Value
Purchase Details
Closed on
Aug 19, 2021
Sold by
Garcia Yolanda
Bought by
Garcia Jose
Purchase Details
Closed on
Aug 9, 2009
Sold by
Figueroa Alfredo
Bought by
Figueroa Janet
Purchase Details
Closed on
Jun 9, 2009
Sold by
Garcia Jose
Bought by
Federal National Mortgage Association
Purchase Details
Closed on
Jan 12, 2006
Sold by
Green Mark and Green Nancy
Bought by
Garica Jose
Home Financials for this Owner
Home Financials are based on the most recent Mortgage that was taken out on this home.
Original Mortgage
$245,600
Interest Rate
1%
Mortgage Type
Negative Amortization
Create a Home Valuation Report for This Property
The Home Valuation Report is an in-depth analysis detailing your home's value as well as a comparison with similar homes in the area
Home Values in the Area
Average Home Value in this Area
Purchase History
| Date | Buyer | Sale Price | Title Company |
|---|---|---|---|
| Garcia Family Trust | -- | None Listed On Document | |
| Garcia Jose | -- | Stewart Title Of Ca Inc | |
| Garcia Jose | $475,000 | Stewart Title Of Ca Inc | |
| Figueroa Janet | -- | Old Republic Title Company | |
| Figueroa Janet | $63,000 | Old Republic Title Company | |
| Federal National Mortgage Association | $284,645 | Landsafe Title | |
| Garica Jose | $307,000 | Alliance Title Company |
Source: Public Records
Mortgage History
| Date | Status | Borrower | Loan Amount |
|---|---|---|---|
| Previous Owner | Garica Jose | $245,600 |
Source: Public Records
Tax History Compared to Growth
Tax History
| Year | Tax Paid | Tax Assessment Tax Assessment Total Assessment is a certain percentage of the fair market value that is determined by local assessors to be the total taxable value of land and additions on the property. | Land | Improvement |
|---|---|---|---|---|
| 2025 | $4,092 | $350,196 | $192,608 | $157,588 |
| 2024 | $3,990 | $343,331 | $188,832 | $154,499 |
| 2023 | $3,879 | $336,600 | $185,130 | $151,470 |
| 2022 | $3,818 | $330,000 | $181,500 | $148,500 |
| 2021 | $908 | $75,117 | $23,845 | $51,272 |
| 2020 | $890 | $74,348 | $23,601 | $50,747 |
| 2019 | $895 | $72,891 | $23,139 | $49,752 |
| 2018 | $837 | $71,463 | $22,686 | $48,777 |
| 2017 | $909 | $70,063 | $22,242 | $47,821 |
| 2016 | $808 | $68,690 | $21,806 | $46,884 |
| 2015 | $833 | $67,659 | $21,479 | $46,180 |
| 2014 | $826 | $66,335 | $21,059 | $45,276 |
Source: Public Records
Map
Nearby Homes
- 1122 Fresno St
- 619-657 Inyo Ave
- 1118 Strawbridge Dr
- 1511 W Tulare Ave
- 1441 Kern St
- 1235 N St
- 1059 Q St
- 1059 P St
- 1317 Tamarack Ct
- 1939 L St
- 1057 Aiden Dr
- 2203 Mia Dr
- 2209 Mia Dr
- 2215 Mia Dr
- 2221 Mia Dr
- 2211 Sunshine Dr
- 2222 Mia Dr
- Palomino Plan at Mattos Ranch
- Blazer Plan at Mattos Ranch
- Morgan Plan at Mattos Ranch