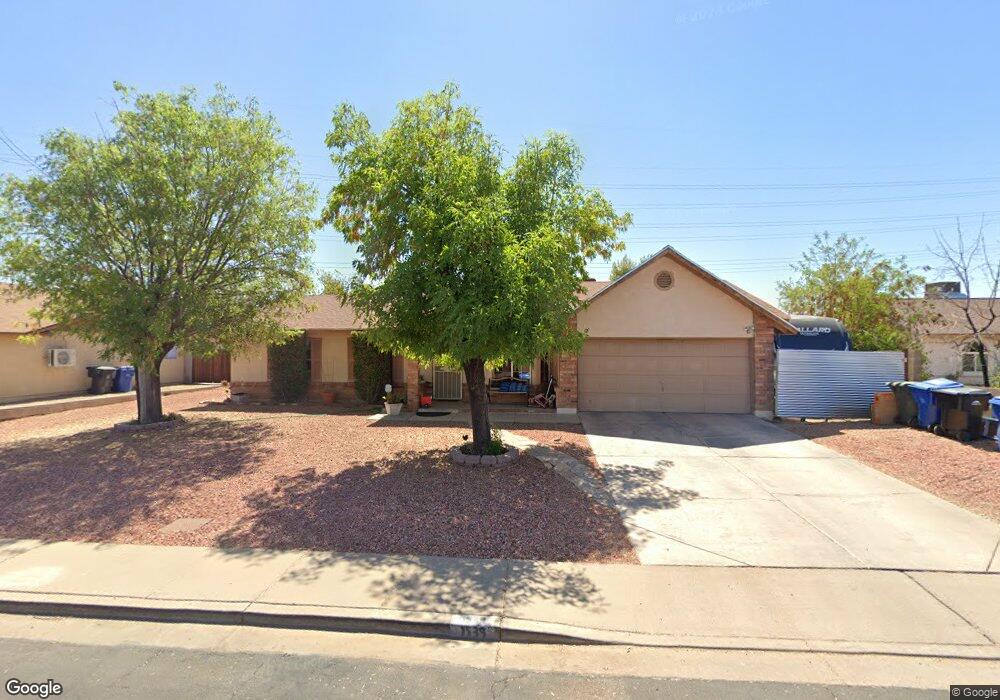
1539 S Maple Cir Mesa, AZ 85206
Central Mesa NeighborhoodEstimated Value: $423,581 - $456,000
Studio
2
Baths
1,322
Sq Ft
$333/Sq Ft
Est. Value
About This Home
This home is located at 1539 S Maple Cir, Mesa, AZ 85206 and is currently estimated at $439,895, approximately $332 per square foot. 1539 S Maple Cir is a home located in Maricopa County with nearby schools including Johnson Elementary School, Franklin at Brimhall Elementary School, and Franklin West Elementary School.
Ownership History
Date
Name
Owned For
Owner Type
Purchase Details
Closed on
Jun 10, 1998
Sold by
Ott Danny A and Ott Lori A
Bought by
Rodriguez Manuel D and Rodriguez Annette G
Current Estimated Value
Home Financials for this Owner
Home Financials are based on the most recent Mortgage that was taken out on this home.
Original Mortgage
$111,299
Outstanding Balance
$22,227
Interest Rate
7.03%
Mortgage Type
FHA
Estimated Equity
$417,668
Purchase Details
Closed on
Sep 16, 1996
Sold by
Waite Delton T and Waite Cindy L
Bought by
Ott Dan A and Ott Lori A
Home Financials for this Owner
Home Financials are based on the most recent Mortgage that was taken out on this home.
Original Mortgage
$99,000
Interest Rate
8.3%
Mortgage Type
New Conventional
Create a Home Valuation Report for This Property
The Home Valuation Report is an in-depth analysis detailing your home's value as well as a comparison with similar homes in the area
Home Values in the Area
Average Home Value in this Area
Purchase History
We collect this data history from publicly available records. To have your information removed, we recommend requesting removal directly through your county’s website.
| Date | Buyer | Sale Price | Title Company |
|---|---|---|---|
| Rodriguez Manuel D | $112,000 | Ati Title Company | |
| Ott Dan A | $110,000 | Ati Title Agency |
Source: Public Records
Mortgage History
We collect this data history from publicly available records. To have your information removed, we recommend requesting removal directly through your county’s website.
| Date | Status | Borrower | Loan Amount |
|---|---|---|---|
| Open | Rodriguez Manuel D | $111,299 | |
| Previous Owner | Ott Dan A | $99,000 |
Source: Public Records
Tax History
| Year | Tax Paid | Tax Assessment Tax Assessment Total Assessment is a certain percentage of the fair market value that is determined by local assessors to be the total taxable value of land and additions on the property. | Land | Improvement |
|---|---|---|---|---|
| 2025 | $1,573 | $18,945 | -- | -- |
| 2024 | $1,591 | $18,043 | -- | -- |
| 2023 | $1,591 | $34,030 | $6,800 | $27,230 |
| 2022 | $1,556 | $26,300 | $5,260 | $21,040 |
| 2021 | $1,598 | $25,060 | $5,010 | $20,050 |
| 2020 | $1,577 | $23,320 | $4,660 | $18,660 |
| 2019 | $1,461 | $20,400 | $4,080 | $16,320 |
| 2018 | $1,395 | $21,080 | $4,210 | $16,870 |
| 2017 | $1,351 | $16,980 | $3,390 | $13,590 |
| 2016 | $1,326 | $16,520 | $3,300 | $13,220 |
| 2015 | $1,252 | $15,520 | $3,100 | $12,420 |
Source: Public Records
Map
Nearby Homes
- 1811 S 39th St Unit 43
- 1811 S 39th St Unit 73
- 3713 E Isabella Ave
- 1350 S Greenfield Rd Unit 1187
- 1350 S Greenfield Rd Unit 1216
- 1350 S Greenfield Rd Unit 1053
- 1822 S 39th St Unit 115
- 1822 S 39th St Unit 103
- 1822 S 39th St Unit 39
- 3719 E Inverness Ave Unit 92
- 3719 E Inverness Ave Unit 103
- 4121 E Valley Auto Dr Unit 109
- 1150 S Oakland Unit 2
- 3510 E Hampton Ave Unit 17
- 4106 E Fairview Cir
- 4049 E Emelita Ave
- 1015 S Val Vista Dr Unit 72
- 1015 S Val Vista Dr Unit 28
- 1015 S Val Vista Dr Unit 33
- 1015 S Val Vista Dr Unit 68
- 1521 S Maple Cir
- 1557 S Maple Cir
- 1522 S Maple Cir
- 1503 S Maple Cir
- 1504 S Maple Cir
- 1540 S Maple Cir
- 1558 S Maple Cir
- 3915 E Holmes Ave
- 3903 E Holmes Ave
- 3954 E Holmes Ave
- 3966 E Holmes Ave
- 3940 E Holmes Ave
- 3928 E Holmes Ave
- 3914 E Holmes Ave
- 4004 E Holmes Ave
- 3961 E Harmony Ave
- 3947 E Harmony Ave
- 3902 E Holmes Ave
- 3933 E Harmony Ave
- 4008 E Holmes Ave
Your Personal Tour Guide
Ask me questions while you tour the home.