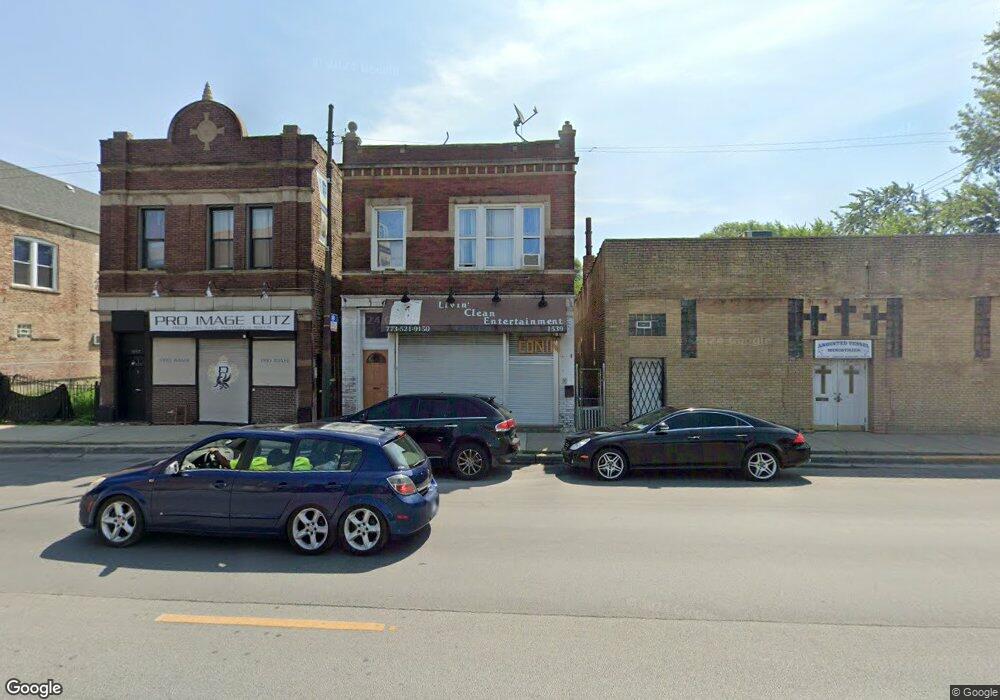
1539 S Pulaski Rd Chicago, IL 60623
North Lawndale NeighborhoodEstimated Value: $143,175 - $311,000
3
Beds
2
Baths
2,554
Sq Ft
$92/Sq Ft
Est. Value
About This Home
This home is located at 1539 S Pulaski Rd, Chicago, IL 60623 and is currently estimated at $234,058, approximately $91 per square foot. 1539 S Pulaski Rd is a home located in Cook County with nearby schools including Penn Elementary School, KIPP Chicago Chrtrs - Ascend Acad, and Chicago West Side Christian School.
Ownership History
Date
Name
Owned For
Owner Type
Purchase Details
Closed on
Nov 14, 2019
Sold by
Unified Investors Inc
Bought by
Ramirez Tomas
Current Estimated Value
Purchase Details
Closed on
Jan 6, 2003
Sold by
Bibleway Apostolic Faith Church
Bought by
Unified Investors Inc
Home Financials for this Owner
Home Financials are based on the most recent Mortgage that was taken out on this home.
Original Mortgage
$58,000
Interest Rate
4.25%
Mortgage Type
Commercial
Purchase Details
Closed on
Mar 21, 2002
Sold by
Mathis Annette
Bought by
Bibleway Apostolic Faith Church
Purchase Details
Closed on
Dec 26, 2001
Sold by
Mathis Annette
Bought by
Bible Way Apostolic Faith Church
Purchase Details
Closed on
Mar 1, 2000
Sold by
Mathis Annette
Bought by
Mathis Annette V
Purchase Details
Closed on
Apr 10, 1997
Sold by
Golberg Robert
Bought by
Annette Mathis & Bible Way Apostolic Chu
Create a Home Valuation Report for This Property
The Home Valuation Report is an in-depth analysis detailing your home's value as well as a comparison with similar homes in the area
Home Values in the Area
Average Home Value in this Area
Purchase History
| Date | Buyer | Sale Price | Title Company |
|---|---|---|---|
| Ramirez Tomas | $85,000 | First American Title | |
| Unified Investors Inc | -- | Centennial Title Incorporate | |
| Bibleway Apostolic Faith Church | -- | Chicago Title Insurance Co | |
| Bible Way Apostolic Faith Church | -- | -- | |
| Mathis Annette V | -- | Chicago Title Insurance Co | |
| Annette Mathis & Bible Way Apostolic Chu | -- | -- |
Source: Public Records
Mortgage History
| Date | Status | Borrower | Loan Amount |
|---|---|---|---|
| Previous Owner | Unified Investors Inc | $58,000 |
Source: Public Records
Tax History Compared to Growth
Tax History
| Year | Tax Paid | Tax Assessment Tax Assessment Total Assessment is a certain percentage of the fair market value that is determined by local assessors to be the total taxable value of land and additions on the property. | Land | Improvement |
|---|---|---|---|---|
| 2024 | $1,693 | $12,600 | $4,543 | $8,057 |
| 2023 | $1,651 | $8,000 | $3,681 | $4,319 |
| 2022 | $1,651 | $8,000 | $3,681 | $4,319 |
| 2021 | $1,614 | $7,999 | $3,681 | $4,318 |
| 2020 | $2,089 | $9,346 | $3,681 | $5,665 |
| 2019 | $2,166 | $10,743 | $3,681 | $7,062 |
| 2018 | $2,129 | $10,743 | $3,681 | $7,062 |
| 2017 | $3,752 | $17,371 | $3,289 | $14,082 |
| 2016 | $3,479 | $17,371 | $3,289 | $14,082 |
| 2015 | $3,183 | $17,371 | $3,289 | $14,082 |
| 2014 | $2,786 | $15,015 | $3,133 | $11,882 |
| 2013 | $2,731 | $15,015 | $3,133 | $11,882 |
Source: Public Records
Map
Nearby Homes
- 1513 S Komensky Ave
- 1539 S Harding Ave
- 1453 S Springfield Ave
- 4107 W 16th St
- 1436 S Karlov Ave
- 1455 S Avers Ave
- 1510 S Hamlin Ave
- 1818 S Harding Ave
- 1620 S Kedvale Ave
- 1517 S Keeler Ave
- 1838 S Springfield Ave Unit A
- 1840 S Springfield Ave
- 1839 S Springfield Ave
- 1509 S Ridgeway Ave
- 1831 S Avers Ave
- 1300 S Karlov Ave
- 1248 S Springfield Ave
- 1825 S Komensky Ave
- 1855 S Komensky Ave
- 1810 S Ridgeway Ave
- 1541 S Pulaski Rd
- 1537 S Pulaski Rd
- 1533 S Pulaski Rd
- 1529 S Pulaski Rd Unit 2F
- 1527 S Pulaski Rd
- 3952 W 16th St
- 1525 S Pulaski Rd
- 3954 W 16th St
- 1544 S Harding Ave
- 3958 W 16th St
- 1542 S Harding Ave
- 1523 S Pulaski Rd
- 1523 S Pulaski Rd Unit 2
- 1523 S Pulaski Rd
- 1532 S Harding Ave
- 1538 S Harding Ave
- 1528 S Harding Ave Unit 1
- 1528 S Harding Ave
- 1532 S Pulaski Rd
- 1532 S Pulaski Rd