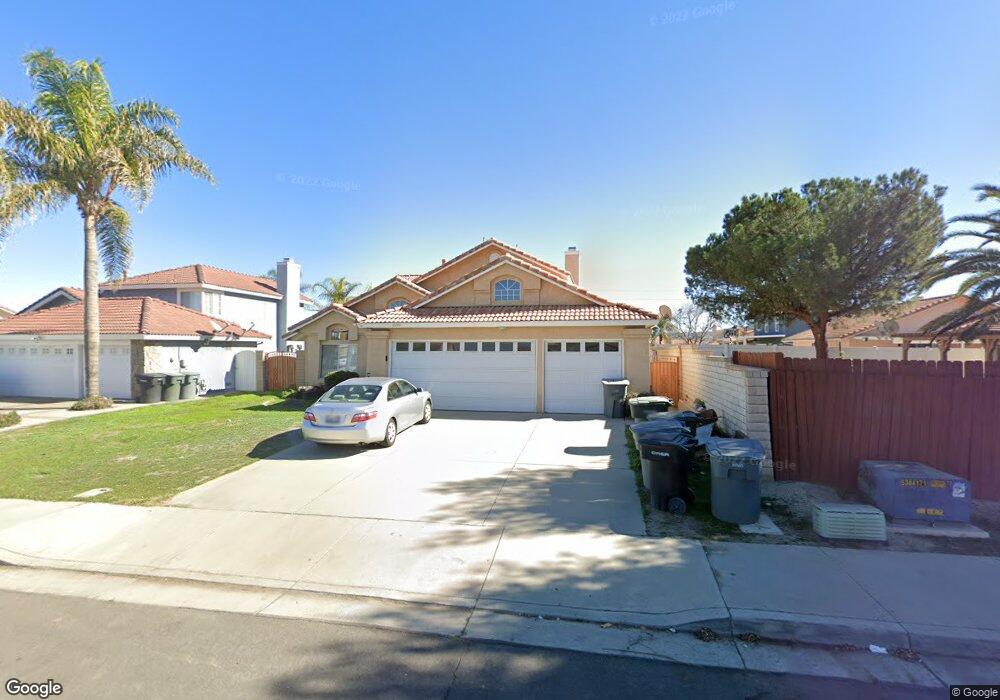
1539 Shady Oaks Dr Perris, CA 92571
Central Perris NeighborhoodEstimated Value: $539,000 - $576,659
4
Beds
3
Baths
2,351
Sq Ft
$237/Sq Ft
Est. Value
About This Home
This home is located at 1539 Shady Oaks Dr, Perris, CA 92571 and is currently estimated at $557,665, approximately $237 per square foot. 1539 Shady Oaks Dr is a home located in Riverside County with nearby schools including Sky View Elementary School, Pinacate Middle School, and Perris High School.
Ownership History
Date
Name
Owned For
Owner Type
Purchase Details
Closed on
May 25, 2016
Sold by
Felix Timothy C and Felix Ronnie R
Bought by
Felix Ronnie R
Current Estimated Value
Purchase Details
Closed on
Nov 16, 2015
Sold by
Felix Ronnie R
Bought by
Felix Ronnie R and The Ronnie R Felix Family Trust
Purchase Details
Closed on
Sep 20, 2010
Sold by
Felix Eleanor M
Bought by
Felix Ronnie R
Purchase Details
Closed on
Jan 11, 2010
Sold by
Alexander Don E and Alexander Betty Jean
Bought by
Felix Ronnie R and Felix Eleanor M
Home Financials for this Owner
Home Financials are based on the most recent Mortgage that was taken out on this home.
Original Mortgage
$108,500
Interest Rate
4.93%
Mortgage Type
New Conventional
Purchase Details
Closed on
Mar 22, 1994
Sold by
Ray Charles S and Ray Jo Ann
Bought by
Alexander Don E and Alexander Betty Jean
Home Financials for this Owner
Home Financials are based on the most recent Mortgage that was taken out on this home.
Original Mortgage
$118,800
Interest Rate
7.79%
Create a Home Valuation Report for This Property
The Home Valuation Report is an in-depth analysis detailing your home's value as well as a comparison with similar homes in the area
Home Values in the Area
Average Home Value in this Area
Purchase History
| Date | Buyer | Sale Price | Title Company |
|---|---|---|---|
| Felix Ronnie R | -- | None Available | |
| Felix Ronnie R | -- | None Available | |
| Felix Ronnie R | -- | Fidelity National Title Co | |
| Felix Ronnie R | $208,500 | Fidelity Natl Title Co Ie | |
| Alexander Don E | $135,000 | Quality Title |
Source: Public Records
Mortgage History
| Date | Status | Borrower | Loan Amount |
|---|---|---|---|
| Previous Owner | Felix Ronnie R | $108,500 | |
| Previous Owner | Alexander Don E | $118,800 |
Source: Public Records
Tax History Compared to Growth
Tax History
| Year | Tax Paid | Tax Assessment Tax Assessment Total Assessment is a certain percentage of the fair market value that is determined by local assessors to be the total taxable value of land and additions on the property. | Land | Improvement |
|---|---|---|---|---|
| 2025 | $3,060 | $269,120 | $32,263 | $236,857 |
| 2023 | $3,060 | $258,671 | $31,011 | $227,660 |
| 2022 | $3,024 | $253,600 | $30,403 | $223,197 |
| 2021 | $2,966 | $248,628 | $29,807 | $218,821 |
| 2020 | $2,929 | $246,080 | $29,502 | $216,578 |
| 2019 | $2,863 | $241,256 | $28,924 | $212,332 |
| 2018 | $2,736 | $236,526 | $28,357 | $208,169 |
| 2017 | $2,699 | $231,889 | $27,801 | $204,088 |
| 2016 | $2,679 | $228,847 | $27,397 | $201,450 |
| 2015 | $2,690 | $225,412 | $26,987 | $198,425 |
| 2014 | $2,631 | $220,998 | $26,459 | $194,539 |
Source: Public Records
Map
Nearby Homes
- 1443 Caron Ct
- 1534 Wilson Ave
- 1462 Apple Creek Dr
- 1630 Glenview Dr
- 702 Clearwater Dr
- 1529 Arrow Creek Dr
- 1878 Neptune Dr
- 1562 Remembrance Dr
- 1753 Jade Ave
- 754 Manecita Cir
- 726 Manecita Cir
- 1676 Amethyst Dr
- 701 Citrus Ave
- 359 Bahia St
- 1560 Gallatin Cir
- 1552 Gallatin Cir
- 1864 Havasu St
- 1210 Trojan Cir
- 507 Coudures Way
- 1232 Trojan Cir
- 1547 Shady Oaks Dr
- 744 Mahogany Ln
- 752 Mahogany Ln
- 1561 Shady Oaks Dr
- 1542 Caron Ct
- 764 Mahogany Ln
- 1548 Caron Ct
- 1562 Caron Ct
- 1575 Shady Oaks Dr
- 772 Mahogany Ln
- 1540 Shady Oaks Dr
- 1534 Shady Oaks Dr
- 1546 Shady Oaks Dr
- 1576 Caron Ct
- 1526 Shady Oaks Dr
- 1560 Shady Oaks Dr
- 1589 Shady Oaks Dr
- 1514 Shady Oaks Dr
- 1574 Shady Oaks Dr
- 751 Mahogany Ln