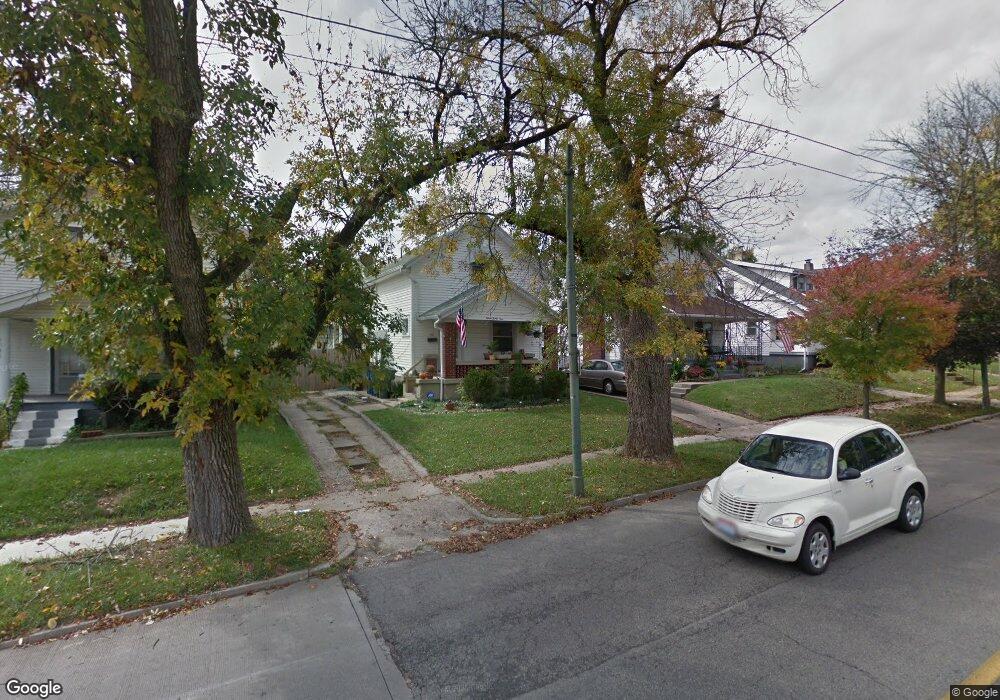
1539 Watervliet Ave Dayton, OH 45420
Belmont NeighborhoodEstimated Value: $139,000 - $161,000
2
Beds
2
Baths
1,090
Sq Ft
$138/Sq Ft
Est. Value
About This Home
This home is located at 1539 Watervliet Ave, Dayton, OH 45420 and is currently estimated at $150,198, approximately $137 per square foot. 1539 Watervliet Ave is a home located in Montgomery County with nearby schools including Horace Mann Elementary School, Eastmont Elementary, and Cleveland Elementary School.
Ownership History
Date
Name
Owned For
Owner Type
Purchase Details
Closed on
Nov 15, 2024
Sold by
Coffman Mary C
Bought by
Barnard Jacqueline N Fetter
Current Estimated Value
Purchase Details
Closed on
Feb 4, 2010
Sold by
The Bank Of New York Mellon
Bought by
Lawson Wiley J
Purchase Details
Closed on
Oct 29, 2009
Sold by
Conover Ruby N
Bought by
The Bank Of New York
Purchase Details
Closed on
Jul 15, 2005
Sold by
Begley Victoria A and Adams Victoria A
Bought by
Conover Ruby N
Home Financials for this Owner
Home Financials are based on the most recent Mortgage that was taken out on this home.
Original Mortgage
$54,000
Interest Rate
10.87%
Mortgage Type
New Conventional
Purchase Details
Closed on
Jan 8, 2004
Sold by
Estate Of Margaret Antoinette Adams
Bought by
Begley Victora A and Adams Zane O
Purchase Details
Closed on
Dec 22, 2003
Sold by
Adams Zane O
Bought by
Begley Victoria A and Adams Victoria A
Create a Home Valuation Report for This Property
The Home Valuation Report is an in-depth analysis detailing your home's value as well as a comparison with similar homes in the area
Home Values in the Area
Average Home Value in this Area
Purchase History
| Date | Buyer | Sale Price | Title Company |
|---|---|---|---|
| Barnard Jacqueline N Fetter | $33,087 | None Listed On Document | |
| Barnard Jacqueline N Fetter | $33,087 | None Listed On Document | |
| Lawson Wiley J | $25,000 | Federated Land Title Agency | |
| The Bank Of New York | $40,667 | Attorney | |
| Conover Ruby N | $60,000 | -- | |
| Begley Victora A | -- | -- | |
| Begley Victoria A | -- | -- | |
| Begley Victoria A | -- | -- |
Source: Public Records
Mortgage History
| Date | Status | Borrower | Loan Amount |
|---|---|---|---|
| Previous Owner | Conover Ruby N | $54,000 |
Source: Public Records
Tax History Compared to Growth
Tax History
| Year | Tax Paid | Tax Assessment Tax Assessment Total Assessment is a certain percentage of the fair market value that is determined by local assessors to be the total taxable value of land and additions on the property. | Land | Improvement |
|---|---|---|---|---|
| 2024 | $2,091 | $37,260 | $8,000 | $29,260 |
| 2023 | $2,091 | $37,260 | $8,000 | $29,260 |
| 2022 | $1,867 | $25,700 | $5,520 | $20,180 |
| 2021 | $1,857 | $25,700 | $5,520 | $20,180 |
| 2020 | $1,853 | $25,700 | $5,520 | $20,180 |
| 2019 | $1,788 | $22,350 | $5,520 | $16,830 |
| 2018 | $1,790 | $22,350 | $5,520 | $16,830 |
| 2017 | $1,776 | $22,350 | $5,520 | $16,830 |
| 2016 | $1,818 | $21,760 | $5,520 | $16,240 |
| 2015 | $1,719 | $21,760 | $5,520 | $16,240 |
| 2014 | $1,719 | $21,760 | $5,520 | $16,240 |
| 2012 | -- | $20,360 | $5,510 | $14,850 |
Source: Public Records
Map
Nearby Homes
- 2830 Kennedy Ave
- 1840 Culver Ave
- 2908 Kingston Ave
- 1300 Watervliet Ave
- 1829 Hazel Ave
- 2704 Hazel Ave
- 1513 Horlacher Ave
- 1512 Horlacher Ave
- 1508 Horlacher Ave
- 2603 Kennedy Ave
- 1542 Scottsdale Dr
- 1530 Patterson Rd
- 1525 Patterson Rd
- 2004 Hazel Ave
- 1108 Chelsea Ave
- 1025 Weng Ave
- 952 Weng Ave
- 934 Weng Ave
- 1012 Chelsea Ave
- 4802 Amesborough Rd
- 1541 Watervliet Ave
- 1533 Watervliet Ave
- 1529 Watervliet Ave
- 1545 Watervliet Ave
- 2125 Ewalt Ave
- 2117 Ewalt Ave
- 1525 Watervliet Ave
- 1525 Watervliet Ave Unit 1527
- 1527 Watervliet Ave
- 2109 Ewalt Ave
- 2105 Ewalt Ave
- 1521 Watervliet Ave
- 1540 Watervliet Ave
- 2101 Ewalt Ave
- 1536 Watervliet Ave
- 1532 Watervliet Ave
- 1601 Watervliet Ave
- 1519 Watervliet Ave
- 2035 Ewalt Ave
- 1530 Watervliet Ave