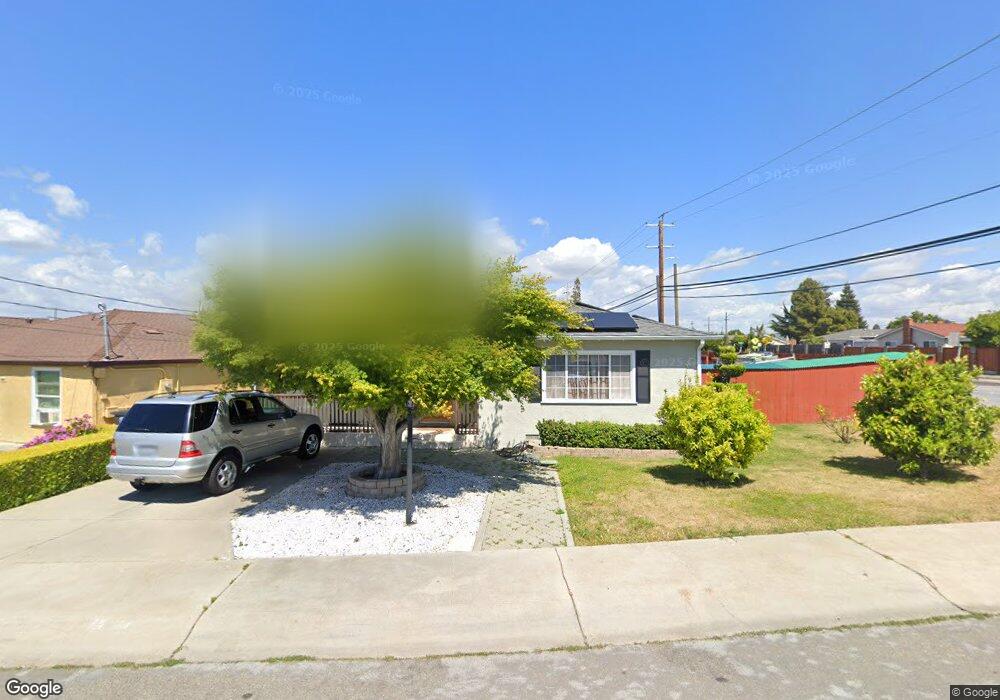
15398 Beatty St San Leandro, CA 94579
Washington Manor-Bonaire NeighborhoodEstimated Value: $734,387 - $889,000
2
Beds
1
Bath
1,096
Sq Ft
$742/Sq Ft
Est. Value
About This Home
This home is located at 15398 Beatty St, San Leandro, CA 94579 and is currently estimated at $813,347, approximately $742 per square foot. 15398 Beatty St is a home located in Alameda County with nearby schools including Dayton Elementary School, Washington Manor Middle School, and Arroyo High School.
Ownership History
Date
Name
Owned For
Owner Type
Purchase Details
Closed on
Mar 26, 2003
Sold by
Wotruba Julie
Bought by
Cehic Samomir
Current Estimated Value
Home Financials for this Owner
Home Financials are based on the most recent Mortgage that was taken out on this home.
Original Mortgage
$295,000
Outstanding Balance
$122,068
Interest Rate
5.25%
Estimated Equity
$691,279
Purchase Details
Closed on
Sep 9, 1997
Sold by
Sullivan Dennis M and Sullivan Judith R
Bought by
Wotruba Julie
Home Financials for this Owner
Home Financials are based on the most recent Mortgage that was taken out on this home.
Original Mortgage
$152,789
Interest Rate
7.34%
Mortgage Type
FHA
Purchase Details
Closed on
Apr 26, 1993
Sold by
Sullivan Dennis M and Sullivan Judith R
Bought by
Sullivan Dennis M and Sullivan Judith R
Create a Home Valuation Report for This Property
The Home Valuation Report is an in-depth analysis detailing your home's value as well as a comparison with similar homes in the area
Home Values in the Area
Average Home Value in this Area
Purchase History
| Date | Buyer | Sale Price | Title Company |
|---|---|---|---|
| Cehic Samomir | $330,000 | Chicago Title Company | |
| Wotruba Julie | $155,000 | Old Republic Title Company | |
| Sullivan Dennis M | -- | -- |
Source: Public Records
Mortgage History
| Date | Status | Borrower | Loan Amount |
|---|---|---|---|
| Open | Cehic Samomir | $295,000 | |
| Previous Owner | Wotruba Julie | $152,789 |
Source: Public Records
Tax History Compared to Growth
Tax History
| Year | Tax Paid | Tax Assessment Tax Assessment Total Assessment is a certain percentage of the fair market value that is determined by local assessors to be the total taxable value of land and additions on the property. | Land | Improvement |
|---|---|---|---|---|
| 2025 | $6,114 | $470,905 | $143,371 | $334,534 |
| 2024 | $6,114 | $461,537 | $140,561 | $327,976 |
| 2023 | $6,088 | $459,353 | $137,806 | $321,547 |
| 2022 | $5,995 | $443,347 | $135,104 | $315,243 |
| 2021 | $5,827 | $434,520 | $132,456 | $309,064 |
| 2020 | $5,697 | $436,995 | $131,098 | $305,897 |
| 2019 | $5,704 | $428,428 | $128,528 | $299,900 |
| 2018 | $5,375 | $420,030 | $126,009 | $294,021 |
| 2017 | $5,126 | $411,796 | $123,539 | $288,257 |
| 2016 | $5,004 | $403,724 | $121,117 | $282,607 |
| 2015 | $4,893 | $397,662 | $119,298 | $278,364 |
| 2014 | $4,820 | $389,874 | $116,962 | $272,912 |
Source: Public Records
Map
Nearby Homes
- 15596 Tilden St
- 15535 Sedgeman St
- 15512 Farnsworth St
- 15373 Inverness St
- 840 Woodgate Dr
- 15106 Edgemoor St
- 747 Lewelling Blvd
- 747 Lewelling Blvd Unit SPC 22
- 720 Fargo Ave Unit 14
- 670 Fargo Ave Unit 5
- 1950 Randy St
- 700 Fargo Ave Unit 2
- 700 Fargo Ave Unit 12
- 1786 Via Chorro
- 650 Fargo Ave Unit 4
- 15102 Chapel Ct
- 15822 Devonwood Way
- 15049 Kesterson St
- 362 Santa Paula
- 15009 Kesterson St
- 15394 Beatty St
- 15397 Andover St
- 15390 Beatty St
- 15393 Andover St
- 15399 Beatty St
- 15388 Beatty St
- 15395 Beatty St
- 15384 Beatty St
- 1087 Belleau St
- 15391 Beatty St
- 1099 Belleau St
- 15387 Andover St
- 1075 Belleau St
- 1105 Belleau St
- 15385 Beatty St
- 1061 Belleau St
- 15380 Beatty St
- 1123 Belleau St
- 15379 Beatty St
- 15381 Andover St