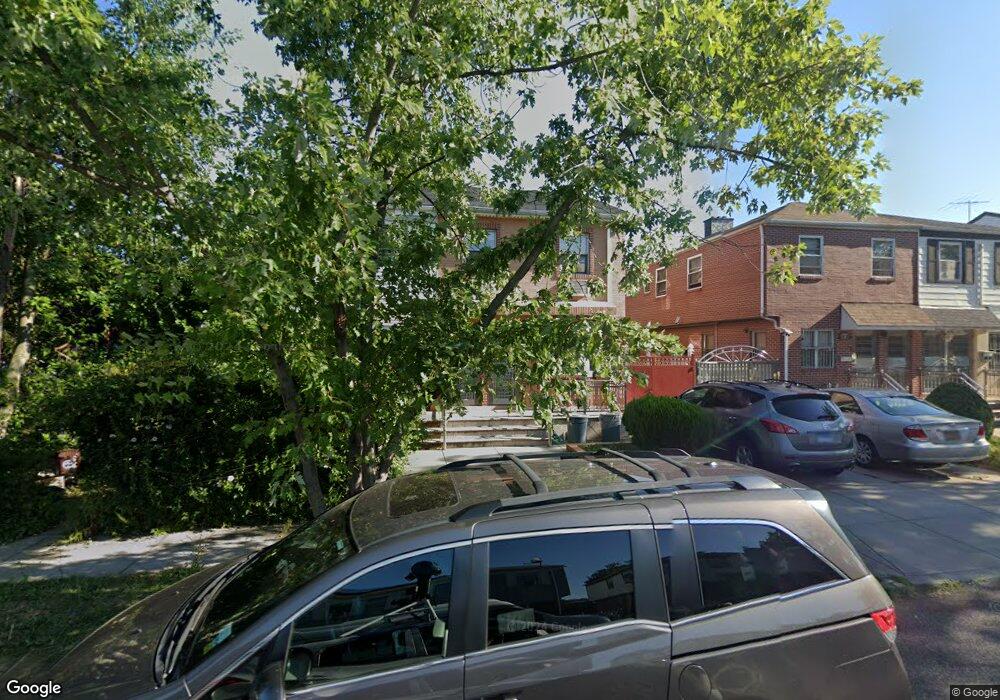
154-03 58th Ave Flushing, NY 11355
Queensboro Hill NeighborhoodEstimated Value: $1,102,752 - $1,315,000
7
Beds
4
Baths
1,727
Sq Ft
$699/Sq Ft
Est. Value
About This Home
This home is located at 154-03 58th Ave, Flushing, NY 11355 and is currently estimated at $1,207,438, approximately $699 per square foot. 154-03 58th Ave is a home located in Queens County with nearby schools including P.S. 163 - Flushing Heights, Rachel Carson I.S. 237Q, and Francis Lewis High School.
Ownership History
Date
Name
Owned For
Owner Type
Purchase Details
Closed on
Aug 17, 2021
Sold by
Chen Mei Lin and Liang Li Tuan
Bought by
Chen Lanying
Current Estimated Value
Home Financials for this Owner
Home Financials are based on the most recent Mortgage that was taken out on this home.
Original Mortgage
$585,000
Outstanding Balance
$527,973
Interest Rate
2.7%
Mortgage Type
Purchase Money Mortgage
Estimated Equity
$679,465
Purchase Details
Closed on
Aug 31, 2009
Sold by
Mei Sui Ning and Mei Ingrid Yim
Bought by
Chen Mei Lin and Liang Li Tuan
Home Financials for this Owner
Home Financials are based on the most recent Mortgage that was taken out on this home.
Original Mortgage
$373,000
Interest Rate
5.36%
Purchase Details
Closed on
Oct 1, 1998
Sold by
Mei Sui Ning and Mei Ingrid Yim
Bought by
Mei Sui Ning and Mei Ingrid Yim
Create a Home Valuation Report for This Property
The Home Valuation Report is an in-depth analysis detailing your home's value as well as a comparison with similar homes in the area
Home Values in the Area
Average Home Value in this Area
Purchase History
| Date | Buyer | Sale Price | Title Company |
|---|---|---|---|
| Chen Lanying | $1,170,000 | -- | |
| Chen Lanying | $1,170,000 | -- | |
| Chen Lanying | $1,170,000 | -- | |
| Chen Mei Lin | $498,000 | -- | |
| Chen Mei Lin | $498,000 | -- | |
| Mei Sui Ning | -- | First American Title Ins Co | |
| Mei Sui Ning | -- | First American Title Ins Co |
Source: Public Records
Mortgage History
| Date | Status | Borrower | Loan Amount |
|---|---|---|---|
| Open | Chen Lanying | $585,000 | |
| Closed | Chen Lanying | $585,000 | |
| Closed | Chen Mei Lin | $373,000 |
Source: Public Records
Tax History
| Year | Tax Paid | Tax Assessment Tax Assessment Total Assessment is a certain percentage of the fair market value that is determined by local assessors to be the total taxable value of land and additions on the property. | Land | Improvement |
|---|---|---|---|---|
| 2025 | $10,327 | $53,760 | $10,955 | $42,805 |
| 2024 | $10,327 | $51,415 | $10,054 | $41,361 |
| 2023 | $9,882 | $49,199 | $9,254 | $39,945 |
| 2022 | $9,683 | $63,240 | $14,220 | $49,020 |
| 2021 | $9,697 | $61,920 | $14,220 | $47,700 |
| 2020 | $9,187 | $66,420 | $14,220 | $52,200 |
| 2019 | $8,670 | $62,160 | $14,220 | $47,940 |
| 2018 | $8,060 | $40,999 | $11,194 | $29,805 |
| 2017 | $7,940 | $40,419 | $11,363 | $29,056 |
| 2016 | $7,601 | $40,419 | $11,363 | $29,056 |
| 2015 | $4,379 | $37,333 | $15,365 | $21,968 |
| 2014 | $4,379 | $35,705 | $14,249 | $21,456 |
Source: Public Records
Map
Nearby Homes
- 59-09 Kissena Blvd
- 54-29 153rd St
- 54-23 153rd St
- 153-51 Horace Harding Expy
- 58-33 150th St
- 150-40 60th Ave
- 150-12 59th Ave
- 152-10 Peck Ave
- 59-41 156th St
- 14849 58th Rd
- 152-12 Peck Ave
- 150-01 Horace Harding Expy
- 14839 60th Ave
- 140-19 Rose Ave
- 6111 156th St
- 6113 156th St
- 159-08 59th Ave
- 150-21 61st Rd
- 5944 159th St
- 148-10 59th Ave
- 15403 58th Ave
- 15401 58th Ave
- 15405 58th Ave
- 15407 58th Ave
- 154-09 58th Ave
- 5707 Kissena Blvd
- 5707 Kissena Blvd
- 15409 58th Ave
- 5705 Kissena Blvd
- 15411 58th Ave
- 5703 Kissena Blvd
- 15415 58th Ave
- 154-4 58th Ave
- 154-04 58th Ave
- 57-01 Kissena Blvd
- 5701 Kissena Blvd
- 15404 58th Ave
- 154-6 58th Ave
- 15410 Booth Memorial Ave
- 15406 58th Ave
Your Personal Tour Guide
Ask me questions while you tour the home.