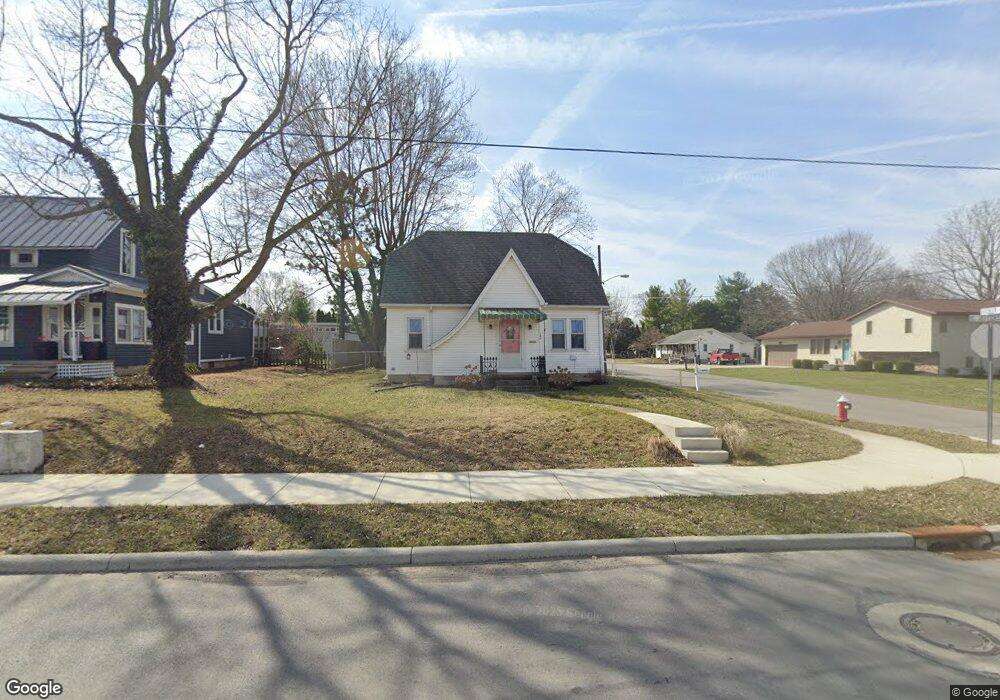
154 E Jefferson St Bluffton, OH 45817
Estimated Value: $155,000 - $233,000
3
Beds
2
Baths
1,411
Sq Ft
$147/Sq Ft
Est. Value
About This Home
This home is located at 154 E Jefferson St, Bluffton, OH 45817 and is currently estimated at $207,072, approximately $146 per square foot. 154 E Jefferson St is a home located in Allen County with nearby schools including Bluffton Elementary School, Bluffton Middle School, and Bluffton High School.
Ownership History
Date
Name
Owned For
Owner Type
Purchase Details
Closed on
Jun 22, 2018
Sold by
Huber Darrell L and Huber Kay A
Bought by
Coffman Megan M
Current Estimated Value
Home Financials for this Owner
Home Financials are based on the most recent Mortgage that was taken out on this home.
Original Mortgage
$80,000
Outstanding Balance
$69,187
Interest Rate
4.5%
Mortgage Type
New Conventional
Estimated Equity
$137,885
Purchase Details
Closed on
Dec 19, 2017
Sold by
Warren Roger L
Bought by
Huber Darrell L and Huber Kay A
Purchase Details
Closed on
Oct 16, 2017
Sold by
Morrison Dennis L and Morrison Donna M
Bought by
Warren Roger L
Purchase Details
Closed on
Nov 10, 2005
Sold by
Mccluer Vedabelle C and Mccluer Vedabelle C
Bought by
Morrison Dennis L and Morrison Donna M
Purchase Details
Closed on
Jan 1, 1990
Bought by
Cahill Vedabelle
Create a Home Valuation Report for This Property
The Home Valuation Report is an in-depth analysis detailing your home's value as well as a comparison with similar homes in the area
Home Values in the Area
Average Home Value in this Area
Purchase History
| Date | Buyer | Sale Price | Title Company |
|---|---|---|---|
| Coffman Megan M | $130,000 | None Available | |
| Huber Darrell L | $130,000 | None Available | |
| Warren Roger L | $115,000 | None Available | |
| Morrison Dennis L | -- | None Available | |
| Cahill Vedabelle | -- | -- |
Source: Public Records
Mortgage History
| Date | Status | Borrower | Loan Amount |
|---|---|---|---|
| Open | Coffman Megan M | $80,000 |
Source: Public Records
Tax History
| Year | Tax Paid | Tax Assessment Tax Assessment Total Assessment is a certain percentage of the fair market value that is determined by local assessors to be the total taxable value of land and additions on the property. | Land | Improvement |
|---|---|---|---|---|
| 2024 | $1,893 | $56,180 | $9,590 | $46,590 |
| 2023 | $1,706 | $46,800 | $7,980 | $38,820 |
| 2022 | $1,723 | $46,800 | $7,980 | $38,820 |
| 2021 | $1,695 | $46,800 | $7,980 | $38,820 |
| 2020 | $1,302 | $32,480 | $7,630 | $24,850 |
| 2019 | $1,302 | $32,480 | $7,630 | $24,850 |
| 2018 | $1,342 | $32,480 | $7,630 | $24,850 |
| 2017 | $1,171 | $28,350 | $7,630 | $20,720 |
| 2016 | $1,184 | $28,350 | $7,630 | $20,720 |
| 2015 | $1,155 | $28,350 | $7,630 | $20,720 |
| 2014 | $1,155 | $26,890 | $7,390 | $19,500 |
| 2013 | $701 | $26,890 | $7,390 | $19,500 |
Source: Public Records
Map
Nearby Homes
- 408 Cherry St
- 0 Ohio 103
- 328 N Main St
- 210 N Jackson St
- 106 Riley St
- 222 N Lawn Ave
- 307 S Main St Unit back
- 218 S Jackson St
- 217 Grove St
- 513 S Jackson St
- 301 Parkview Dr
- 303 Parkview Dr
- 305 Parkview Dr
- 307 Parkview Dr
- 160 Chestnut Ln
- 315 Parkview Dr
- 317 Parkview Dr
- 319 Parkview Dr
- 321 Parkview Dr
- 0 Columbus Grove-Bluffton Rd
- 156 E Jefferson St
- 160 E Jefferson St
- 211 Huber St
- 208 Huber St
- 209 Huber St
- 165 E Elm St
- 172 E Jefferson St
- 169 E Elm St
- 163 E Jefferson St
- 173 E Elm St
- 176 E Jefferson St
- 163 N Mound St
- 180 E Jefferson St
- 190 Huber St
- 168 E Elm St
- 182 E Jefferson St
- 201 E Elm St
- 174 E Elm St
- 153 N Mound St
- 178 E Elm St
Your Personal Tour Guide
Ask me questions while you tour the home.