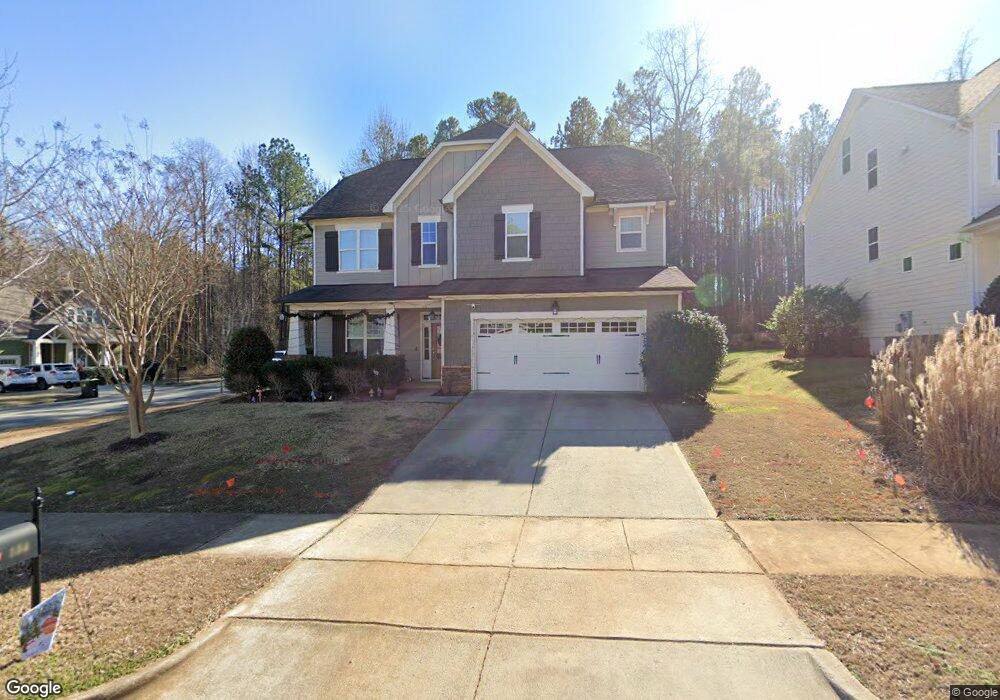
154 Freeman Dr Pittsboro, NC 27312
Estimated Value: $544,000 - $585,618
3
Beds
4
Baths
3,119
Sq Ft
$182/Sq Ft
Est. Value
About This Home
This home is located at 154 Freeman Dr, Pittsboro, NC 27312 and is currently estimated at $567,405, approximately $181 per square foot. 154 Freeman Dr is a home located in Chatham County with nearby schools including Pittsboro Elementary School, George Moses Horton Middle School, and Northwood High.
Ownership History
Date
Name
Owned For
Owner Type
Purchase Details
Closed on
Nov 2, 2019
Sold by
Dochniak Aaron Mark and Dochniak Julia K K
Bought by
Frazier Colleen and Frazier Gregory
Current Estimated Value
Home Financials for this Owner
Home Financials are based on the most recent Mortgage that was taken out on this home.
Original Mortgage
$357,000
Outstanding Balance
$318,082
Interest Rate
4.37%
Mortgage Type
New Conventional
Estimated Equity
$249,323
Purchase Details
Closed on
Jun 15, 2017
Sold by
Farina Samuel A
Bought by
Dochniak Aaron Mark and Dochniak Julia K K
Home Financials for this Owner
Home Financials are based on the most recent Mortgage that was taken out on this home.
Original Mortgage
$333,743
Interest Rate
3.87%
Mortgage Type
FHA
Create a Home Valuation Report for This Property
The Home Valuation Report is an in-depth analysis detailing your home's value as well as a comparison with similar homes in the area
Home Values in the Area
Average Home Value in this Area
Purchase History
| Date | Buyer | Sale Price | Title Company |
|---|---|---|---|
| Frazier Colleen | $357,000 | None Available | |
| Dochniak Aaron Mark | $340,000 | None Available |
Source: Public Records
Mortgage History
| Date | Status | Borrower | Loan Amount |
|---|---|---|---|
| Open | Frazier Colleen | $357,000 | |
| Previous Owner | Dochniak Aaron Mark | $333,743 |
Source: Public Records
Tax History Compared to Growth
Tax History
| Year | Tax Paid | Tax Assessment Tax Assessment Total Assessment is a certain percentage of the fair market value that is determined by local assessors to be the total taxable value of land and additions on the property. | Land | Improvement |
|---|---|---|---|---|
| 2025 | $6,132 | $566,082 | $70,150 | $495,932 |
| 2024 | $6,132 | $359,202 | $61,000 | $298,202 |
| 2023 | $4,420 | $359,202 | $61,000 | $298,202 |
| 2022 | $4,179 | $359,202 | $61,000 | $298,202 |
| 2021 | $4,145 | $359,202 | $61,000 | $298,202 |
| 2020 | $3,680 | $315,828 | $50,000 | $265,828 |
| 2019 | $3,670 | $315,828 | $50,000 | $265,828 |
| 2018 | $3,517 | $315,828 | $50,000 | $265,828 |
| 2017 | $3,517 | $315,828 | $50,000 | $265,828 |
| 2016 | $3,450 | $307,853 | $50,000 | $257,853 |
| 2015 | $3,413 | $307,853 | $50,000 | $257,853 |
| 2014 | $2,627 | $249,000 | $45,000 | $204,000 |
| 2013 | -- | $45,000 | $45,000 | $0 |
Source: Public Records
Map
Nearby Homes
- 73 Freeman Dr
- 26 Danbury Ct
- 1157 Hillsboro St
- 115 Circle City Way
- 7839 U S Highway 64
- 7837 U S Highway 64
- 7841 U S Highway 64
- CHANLEY Plan at Corbett Landing
- CHAMPLAIN Plan at Corbett Landing
- ELMSDALE Plan at Corbett Landing
- SEBASTIAN Plan at Corbett Landing
- DRESDEN Plan at Corbett Landing
- BALLENTINE Plan at Corbett Landing
- PARKETTE Plan at Corbett Landing
- MARABELLE Plan at Corbett Landing
- KENDALL Plan at Corbett Landing
- THEODORE Plan at Corbett Landing
- BRANFORD Plan at Corbett Landing
- KAITLYN Plan at Corbett Landing
- 289 Gaines Trail
- 138 Freeman Dr
- 126 Freeman Dr
- 29 Freeman Dr
- 71 Clarks Creek Rd
- 159 Freeman Dr
- 159 Freeman Dr
- 143 Freeman Dr
- 53 Clarks Creek Rd
- 112 Freeman Dr
- 131 Freeman Dr
- 41 Clarks Creek Rd
- 107 Freeman Dr
- 98 Freeman Dr
- 27 Clarks Creek Rd
- 72 Wickham Dr
- 60 Wickham Dr
- 48 Wickham Dr
- 15 Clarks Creek Rd
- 92 Freeman Dr
- 61 Freeman Dr