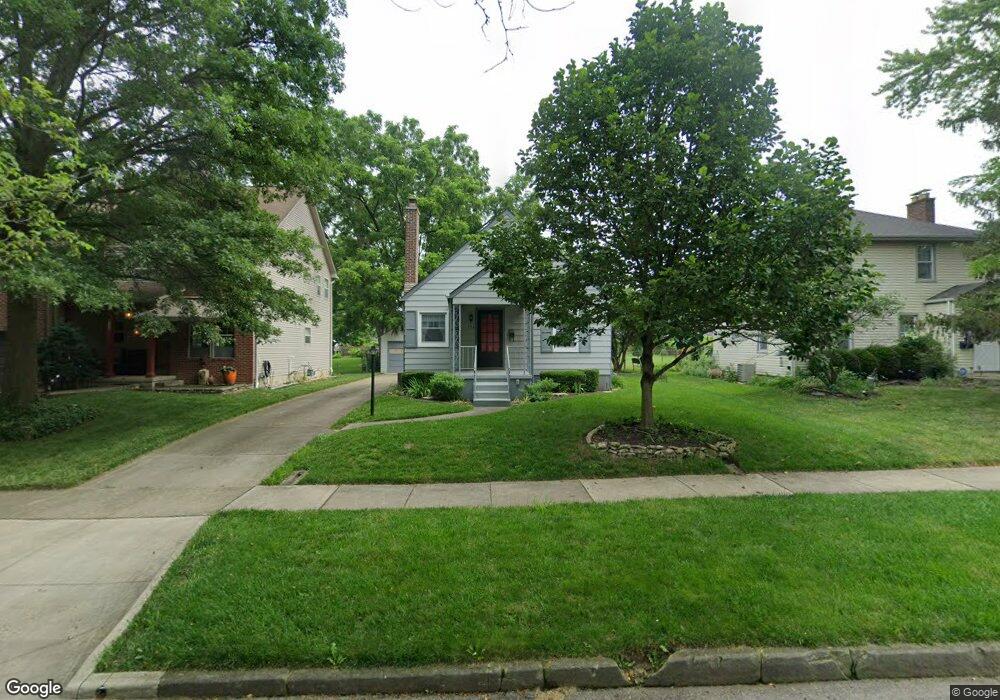
154 Garden Rd Columbus, OH 43214
Clintonville NeighborhoodEstimated Value: $331,801 - $395,000
2
Beds
1
Bath
979
Sq Ft
$367/Sq Ft
Est. Value
About This Home
This home is located at 154 Garden Rd, Columbus, OH 43214 and is currently estimated at $359,700, approximately $367 per square foot. 154 Garden Rd is a home located in Franklin County with nearby schools including Indian Springs Elementary School, Dominion Middle School, and Whetstone High School.
Ownership History
Date
Name
Owned For
Owner Type
Purchase Details
Closed on
Mar 5, 2021
Sold by
Copeland Florence F
Bought by
Copeland Garrett Robert
Current Estimated Value
Purchase Details
Closed on
Nov 30, 2011
Sold by
Limes Donald R and Limes Ellen M
Bought by
Copeland Florence F
Home Financials for this Owner
Home Financials are based on the most recent Mortgage that was taken out on this home.
Original Mortgage
$133,200
Outstanding Balance
$91,554
Interest Rate
4.11%
Mortgage Type
New Conventional
Estimated Equity
$268,146
Purchase Details
Closed on
Aug 11, 2006
Sold by
Deweese Stephen S and Estate Of Helen M Mckee
Bought by
Limes Donald R and Limes Ellen M
Home Financials for this Owner
Home Financials are based on the most recent Mortgage that was taken out on this home.
Original Mortgage
$125,000
Interest Rate
6.83%
Mortgage Type
Purchase Money Mortgage
Purchase Details
Closed on
Nov 3, 2005
Sold by
Estate Of Joseph Raymond Mckee
Bought by
Mckee Helen Albright and Mckee Helen M
Create a Home Valuation Report for This Property
The Home Valuation Report is an in-depth analysis detailing your home's value as well as a comparison with similar homes in the area
Home Values in the Area
Average Home Value in this Area
Purchase History
| Date | Buyer | Sale Price | Title Company |
|---|---|---|---|
| Copeland Garrett Robert | -- | None Available | |
| Copeland Florence F | $148,000 | Bxtalon Group | |
| Limes Donald R | $139,900 | Valley Titl | |
| Mckee Helen Albright | -- | -- |
Source: Public Records
Mortgage History
| Date | Status | Borrower | Loan Amount |
|---|---|---|---|
| Open | Copeland Florence F | $133,200 | |
| Previous Owner | Limes Donald R | $125,000 |
Source: Public Records
Tax History Compared to Growth
Tax History
| Year | Tax Paid | Tax Assessment Tax Assessment Total Assessment is a certain percentage of the fair market value that is determined by local assessors to be the total taxable value of land and additions on the property. | Land | Improvement |
|---|---|---|---|---|
| 2024 | $4,443 | $98,990 | $52,680 | $46,310 |
| 2023 | $4,386 | $98,980 | $52,675 | $46,305 |
| 2022 | $4,054 | $78,160 | $37,560 | $40,600 |
| 2021 | $3,606 | $78,160 | $37,560 | $40,600 |
| 2020 | $3,611 | $78,160 | $37,560 | $40,600 |
| 2019 | $3,130 | $60,350 | $28,880 | $31,470 |
| 2018 | $2,818 | $60,350 | $28,880 | $31,470 |
| 2017 | $2,948 | $60,350 | $28,880 | $31,470 |
| 2016 | $2,768 | $50,540 | $21,490 | $29,050 |
| 2015 | $2,513 | $50,540 | $21,490 | $29,050 |
| 2014 | $2,519 | $50,540 | $21,490 | $29,050 |
| 2013 | $1,171 | $48,125 | $20,475 | $27,650 |
Source: Public Records
Map
Nearby Homes
- 156 E Weisheimer Rd
- 255 Garden Rd
- 411 Garden Rd
- 26 E Schreyer Place
- 420 E Beechwold Blvd
- 4 W Royal Forest Blvd
- 381 E Jeffrey Place
- 125 Sheffield Rd
- 522 E Beechwold Blvd
- 518 E Royal Forest Blvd
- 49 W Henderson Rd
- 197 E Cooke Rd
- 116 Rathbone Ave
- 4464 Zeller Rd
- 111 W Henderson Rd
- 4299 Colerain Ave
- 202 Rathbone Ave
- 597 Morse Rd
- 601 Morse Rd
- 4415 Aldrich Place
- 148 Garden Rd
- 162 Garden Rd
- 140 Garden Rd
- 168 Garden Rd
- 134 Garden Rd
- 176 Garden Rd
- 0 E Beaumont Rd
- 149 E Beaumont Rd
- 128 Garden Rd
- 161 E Beaumont Rd
- 182 Garden Rd
- 167 E Beaumont Rd
- 141 E Beaumont Rd
- 175 E Beaumont Rd
- 135 E Beaumont Rd
- 120 Garden Rd
- 188 Garden Rd
- 165 Garden Rd
- 145 Garden Rd
- 167 Garden Rd