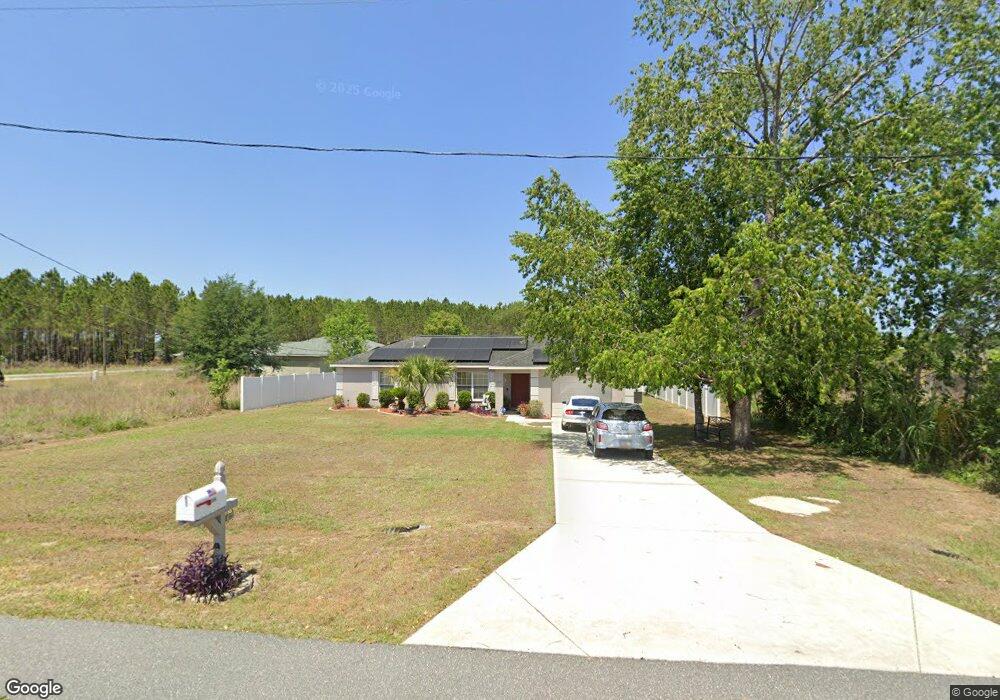
154 Juniper Loop Ocala, FL 34480
Silver Spring Shores NeighborhoodEstimated Value: $172,000 - $276,000
3
Beds
2
Baths
1,248
Sq Ft
$177/Sq Ft
Est. Value
About This Home
This home is located at 154 Juniper Loop, Ocala, FL 34480 and is currently estimated at $220,500, approximately $176 per square foot. 154 Juniper Loop is a home located in Marion County with nearby schools including Legacy Elementary School, Belleview Middle School, and Belleview High School.
Ownership History
Date
Name
Owned For
Owner Type
Purchase Details
Closed on
May 13, 2019
Sold by
Stafford Greg
Bought by
Eden James
Current Estimated Value
Home Financials for this Owner
Home Financials are based on the most recent Mortgage that was taken out on this home.
Original Mortgage
$127,272
Outstanding Balance
$110,252
Interest Rate
4%
Mortgage Type
New Conventional
Estimated Equity
$110,248
Purchase Details
Closed on
Jan 28, 2016
Sold by
Altman Robert and Frick Francis Max
Bought by
Stafford Greg
Purchase Details
Closed on
Dec 31, 2014
Sold by
F&J Developers Llp
Bought by
Frick Francis M and Frick Jobilly
Purchase Details
Closed on
May 22, 2007
Sold by
Maronda Homes Inc Of Florida
Bought by
F & J Developers Llp
Purchase Details
Closed on
Aug 5, 2005
Sold by
Hughes Jeffrey J and Hughes Alice B
Bought by
Maronda Homes Inc Of Florida
Create a Home Valuation Report for This Property
The Home Valuation Report is an in-depth analysis detailing your home's value as well as a comparison with similar homes in the area
Home Values in the Area
Average Home Value in this Area
Purchase History
| Date | Buyer | Sale Price | Title Company |
|---|---|---|---|
| Eden James | $126,000 | Brick City Ttl Ins Agcy Inc | |
| Stafford Greg | $58,500 | Gullett Title | |
| Frick Francis M | -- | None Available | |
| F & J Developers Llp | $18,500 | Kampf Title & Guaranty Corp | |
| Maronda Homes Inc Of Florida | $33,500 | Kampf Title & Guaranty Corp |
Source: Public Records
Mortgage History
| Date | Status | Borrower | Loan Amount |
|---|---|---|---|
| Open | Eden James | $127,272 |
Source: Public Records
Tax History
| Year | Tax Paid | Tax Assessment Tax Assessment Total Assessment is a certain percentage of the fair market value that is determined by local assessors to be the total taxable value of land and additions on the property. | Land | Improvement |
|---|---|---|---|---|
| 2025 | $1,723 | $115,632 | -- | -- |
| 2024 | $1,409 | $107,547 | -- | -- |
| 2023 | $1,369 | $104,415 | $0 | $0 |
| 2022 | $1,327 | $101,374 | $0 | $0 |
| 2021 | $1,317 | $98,421 | $0 | $0 |
| 2020 | $1,304 | $97,062 | $3,500 | $93,562 |
| 2019 | $1,808 | $87,324 | $3,500 | $83,824 |
| 2018 | $1,693 | $83,913 | $3,000 | $80,913 |
| 2017 | $1,667 | $82,096 | $2,300 | $79,796 |
| 2016 | $1,496 | $71,762 | $0 | $0 |
| 2015 | $1,431 | $67,005 | $0 | $0 |
| 2014 | $726 | $25,175 | $0 | $0 |
Source: Public Records
Map
Nearby Homes
- 0 Chestnut Rd Unit MFROM721675
- 24 Juniper Dr
- 241 Chestnut Rd
- 154 Juniper Run
- 50 Larch Run
- 46 Juniper Dr
- 61 Larch Run
- 23 Juniper Loop Ct
- 19 Juniper Loop Run
- 57 Juniper Track
- 251 Chestnut Rd
- 41 Juniper Loop Ct
- 71 Juniper Trail Loop
- 86 Juniper Loop Cir
- 82 Juniper Trail Loop
- 17 Juniper Track Ct
- 54 Juniper Trail Loop
- 58 Juniper Trail Pass
- 66 Juniper Trail Pass
- 70 Juniper Trail Pass
- 0 Chestnut Rd Unit MFROM686098
- 0 Chestnut Rd Unit OM643335
- 0 Chestnut Rd Unit OM521105
- 0 Chestnut Rd Unit 211935
- 0 Chestnut Rd Unit 141820
- 0 Chestnut Rd Unit 282899
- 0 Chestnut Rd Unit 280521
- 0 Chestnut Rd Unit 280379
- 0 Chestnut Rd Unit 539877
- 30 Chestnut Ln
- 17 Juniper Radial
- 150 Juniper Loop
- 151 Juniper Loop
- 11 Juniper Radial
- 25 Chestnut Ln
- 25 Juniper Radial
- 159 Juniper Loop Unit 4
- 159 Juniper Loop Unit 3
- 159 Juniper Loop Unit 2
Your Personal Tour Guide
Ask me questions while you tour the home.