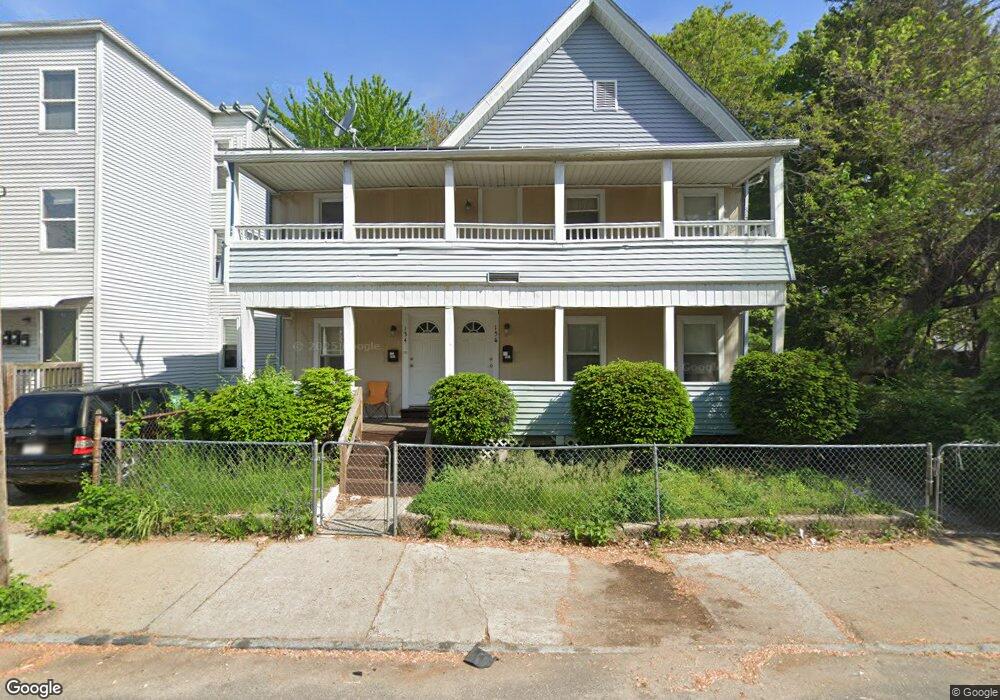
154 Quincy St Unit 156 Springfield, MA 01109
Old Hill NeighborhoodEstimated Value: $263,800 - $448,000
8
Beds
2
Baths
2,832
Sq Ft
$122/Sq Ft
Est. Value
About This Home
This home is located at 154 Quincy St Unit 156, Springfield, MA 01109 and is currently estimated at $344,950, approximately $121 per square foot. 154 Quincy St Unit 156 is a home located in Hampden County with nearby schools including William N. DeBerry Elementary School, M Marcus Kiley Middle, and High School Of Commerce.
Ownership History
Date
Name
Owned For
Owner Type
Purchase Details
Closed on
Jul 14, 2021
Sold by
Campbell Judya M
Bought by
Mckenzie Karen and Facey Sandra
Current Estimated Value
Purchase Details
Closed on
Mar 11, 2011
Sold by
Roffo David
Bought by
Campbell Judya M
Home Financials for this Owner
Home Financials are based on the most recent Mortgage that was taken out on this home.
Original Mortgage
$107,211
Interest Rate
5.25%
Mortgage Type
FHA
Purchase Details
Closed on
Jun 30, 2010
Sold by
First Horizon Home Loa
Bought by
Roffo David
Purchase Details
Closed on
Jan 28, 2010
Sold by
Rodriguez Elvis
Bought by
First Horizon Home Loa
Purchase Details
Closed on
Apr 19, 2005
Sold by
Conner Charles J
Bought by
Rodriguez Elvis
Home Financials for this Owner
Home Financials are based on the most recent Mortgage that was taken out on this home.
Original Mortgage
$105,300
Interest Rate
5.78%
Mortgage Type
Purchase Money Mortgage
Create a Home Valuation Report for This Property
The Home Valuation Report is an in-depth analysis detailing your home's value as well as a comparison with similar homes in the area
Home Values in the Area
Average Home Value in this Area
Purchase History
| Date | Buyer | Sale Price | Title Company |
|---|---|---|---|
| Mckenzie Karen | -- | None Available | |
| Campbell Judya M | $110,000 | -- | |
| Roffo David | $27,500 | -- | |
| First Horizon Home Loa | $57,715 | -- | |
| Rodriguez Elvis | $117,000 | -- |
Source: Public Records
Mortgage History
| Date | Status | Borrower | Loan Amount |
|---|---|---|---|
| Previous Owner | Campbell Judya M | $107,211 | |
| Previous Owner | Rodriguez Elvis | $105,300 |
Source: Public Records
Tax History
| Year | Tax Paid | Tax Assessment Tax Assessment Total Assessment is a certain percentage of the fair market value that is determined by local assessors to be the total taxable value of land and additions on the property. | Land | Improvement |
|---|---|---|---|---|
| 2025 | $3,810 | $243,000 | $23,900 | $219,100 |
| 2024 | $3,573 | $222,500 | $22,400 | $200,100 |
| 2023 | $3,171 | $186,000 | $21,300 | $164,700 |
| 2022 | $2,823 | $150,000 | $19,400 | $130,600 |
| 2021 | $2,754 | $145,700 | $17,600 | $128,100 |
| 2020 | $2,740 | $140,300 | $17,600 | $122,700 |
| 2019 | $2,761 | $140,300 | $17,600 | $122,700 |
| 2018 | $2,585 | $123,100 | $17,600 | $105,500 |
| 2017 | $2,585 | $131,500 | $14,100 | $117,400 |
| 2016 | $2,288 | $116,400 | $14,100 | $102,300 |
| 2015 | $2,032 | $103,300 | $14,100 | $89,200 |
Source: Public Records
Map
Nearby Homes
- 152 Quincy St
- 162 Quincy St
- 647 Union St
- 166 Quincy St
- 149-151 Quincy St Unit 3
- 151 Quincy St
- 149 Quincy St
- 151 Quincy St Unit 2
- 151 Quincy St Unit 3rd FL
- 159 Quincy St Unit 161
- 661 Union St
- 172 Quincy St
- 93 Hancock St
- 665 Union St
- 163 Quincy St
- 176 Quincy St
- 667 Union St
- 97 Hancock St
- 175 Quincy St
- 101 Hancock St
Your Personal Tour Guide
Ask me questions while you tour the home.