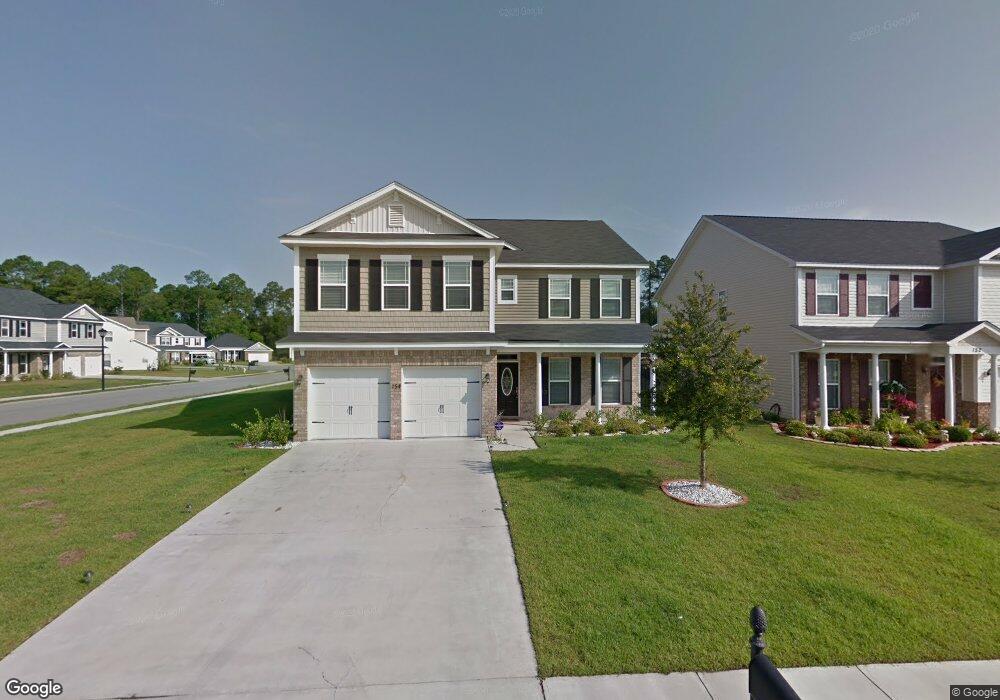
154 Somersby Blvd Pooler, GA 31322
Estimated Value: $384,476 - $438,000
5
Beds
3
Baths
3,440
Sq Ft
$120/Sq Ft
Est. Value
About This Home
This home is located at 154 Somersby Blvd, Pooler, GA 31322 and is currently estimated at $412,869, approximately $120 per square foot. 154 Somersby Blvd is a home located in Chatham County with nearby schools including West Chatham Elementary School, West Chatham Middle School, and New Hampstead High School.
Ownership History
Date
Name
Owned For
Owner Type
Purchase Details
Closed on
Aug 20, 2021
Sold by
Superat Llc
Bought by
Kaushal Atul and Kaushal Superna
Current Estimated Value
Purchase Details
Closed on
Jul 8, 2019
Sold by
Kaushal Atul
Bought by
Superat Llc
Purchase Details
Closed on
Oct 28, 2016
Sold by
Davis Tracy E
Bought by
Kaushal Atul
Home Financials for this Owner
Home Financials are based on the most recent Mortgage that was taken out on this home.
Original Mortgage
$202,960
Interest Rate
3.42%
Mortgage Type
New Conventional
Purchase Details
Closed on
Nov 18, 2009
Sold by
Srh Investments Llc
Bought by
Davis Tracy E
Home Financials for this Owner
Home Financials are based on the most recent Mortgage that was taken out on this home.
Original Mortgage
$246,449
Interest Rate
4.98%
Mortgage Type
FHA
Purchase Details
Closed on
Jan 11, 2007
Sold by
Not Provided
Bought by
Davis Tracy E
Create a Home Valuation Report for This Property
The Home Valuation Report is an in-depth analysis detailing your home's value as well as a comparison with similar homes in the area
Home Values in the Area
Average Home Value in this Area
Purchase History
| Date | Buyer | Sale Price | Title Company |
|---|---|---|---|
| Kaushal Atul | -- | -- | |
| Superat Llc | -- | -- | |
| Kaushal Atul | $253,700 | -- | |
| Davis Tracy E | $250,999 | -- | |
| Davis Tracy E | $1,426,200 | -- |
Source: Public Records
Mortgage History
| Date | Status | Borrower | Loan Amount |
|---|---|---|---|
| Previous Owner | Kaushal Atul | $202,960 | |
| Previous Owner | Davis Tracy E | $246,449 |
Source: Public Records
Tax History Compared to Growth
Tax History
| Year | Tax Paid | Tax Assessment Tax Assessment Total Assessment is a certain percentage of the fair market value that is determined by local assessors to be the total taxable value of land and additions on the property. | Land | Improvement |
|---|---|---|---|---|
| 2025 | $4,479 | $141,600 | $12,160 | $129,440 |
| 2024 | $4,479 | $141,600 | $12,160 | $129,440 |
| 2023 | $4,521 | $141,600 | $12,160 | $129,440 |
| 2022 | $3,822 | $128,920 | $12,160 | $116,760 |
| 2021 | $3,885 | $111,520 | $12,160 | $99,360 |
| 2020 | $3,691 | $108,440 | $12,160 | $96,280 |
| 2019 | $3,691 | $108,000 | $12,160 | $95,840 |
| 2018 | $3,567 | $104,240 | $12,160 | $92,080 |
| 2017 | $3,250 | $101,480 | $11,772 | $89,708 |
| 2016 | $3,136 | $103,560 | $12,160 | $91,400 |
| 2015 | $3,170 | $104,640 | $12,160 | $92,480 |
| 2014 | $4,746 | $119,080 | $0 | $0 |
Source: Public Records
Map
Nearby Homes
- 7 Rolling Springs Ln
- 1335 Pine Barren Rd
- 1325 Pine Barren Rd
- 322 Casey Dr
- 1726 Pine Barren Rd
- 1419 Pine Barren Rd
- 227 Chippingwood Cir
- 1425 Pine Barren Rd
- 208 Chippingwood Cir
- 110 Coach House Square
- 100 Coach House Square
- 303 Morgan Pines Dr
- 300 Morgan Pines Dr
- 405 Olde Ivey Square
- 227 Standing Pine Cir
- 505 Potter Stone Square
- 408 Old Ivy Square
- 509 Potter Stone Square
- 511 Potter Stone Square
- 410 Old Ivy Square
- 152 Somersby Blvd
- 4 Rolling Springs Ln
- 150 Somersby Blvd
- 6 Rolling Springs Ln
- 3 Moss Creek Ct
- 156 Somersby Blvd
- 3 Rolling Springs Ln
- 157 Somersby Blvd
- 148 Somersby Blvd
- 155 Somersby Blvd
- 159 Somersby Blvd
- 5 Moss Creek Ct
- 8 Rolling Springs Ln
- 161 Somersby Blvd
- 153 Somersby Blvd
- 158 Somersby Blvd
- 5 Rolling Springs Ln
- 151 Somersby Blvd
- 10 Rolling Springs Ln
- 0 Moss Creek Ct Unit 7593640