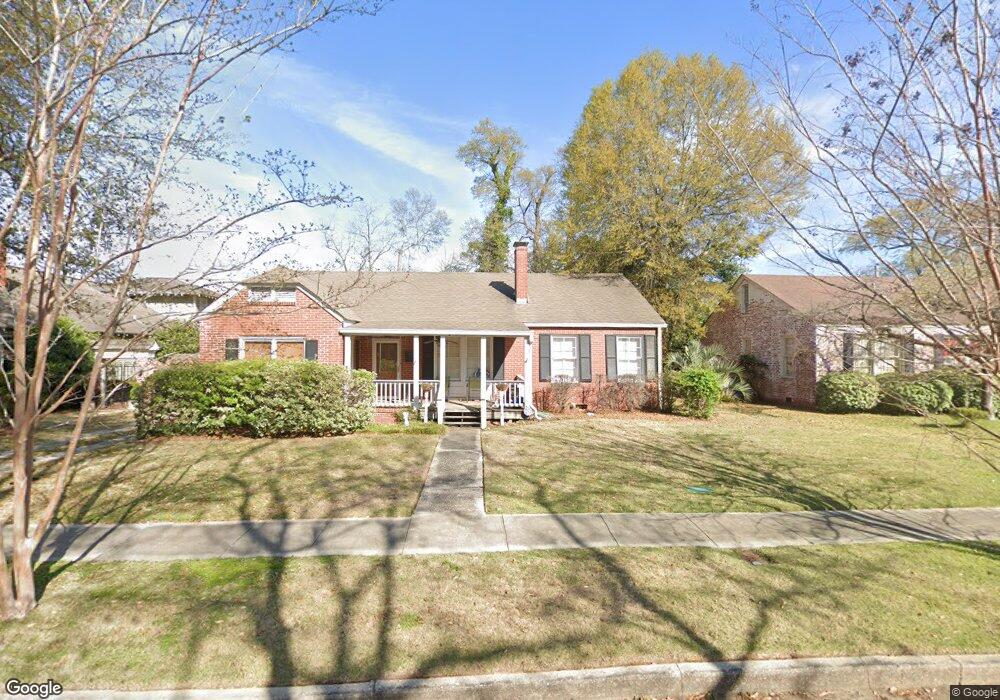
1540 16th Ave Columbus, GA 31901
Saint Elmo Weracoba NeighborhoodEstimated Value: $226,000 - $286,000
3
Beds
3
Baths
1,753
Sq Ft
$148/Sq Ft
Est. Value
About This Home
This home is located at 1540 16th Ave, Columbus, GA 31901 and is currently estimated at $259,604, approximately $148 per square foot. 1540 16th Ave is a home located in Muscogee County with nearby schools including Richards Middle School, Jordan Vocational High School, and Wynnton Elementary School.
Ownership History
Date
Name
Owned For
Owner Type
Purchase Details
Closed on
Nov 28, 2017
Sold by
Seeds Angela M
Bought by
Rodriguez Angel
Current Estimated Value
Home Financials for this Owner
Home Financials are based on the most recent Mortgage that was taken out on this home.
Original Mortgage
$162,011
Outstanding Balance
$136,151
Interest Rate
3.87%
Mortgage Type
FHA
Estimated Equity
$123,453
Create a Home Valuation Report for This Property
The Home Valuation Report is an in-depth analysis detailing your home's value as well as a comparison with similar homes in the area
Home Values in the Area
Average Home Value in this Area
Purchase History
| Date | Buyer | Sale Price | Title Company |
|---|---|---|---|
| Rodriguez Angel | $165,000 | -- |
Source: Public Records
Mortgage History
| Date | Status | Borrower | Loan Amount |
|---|---|---|---|
| Open | Rodriguez Angel | $162,011 |
Source: Public Records
Tax History Compared to Growth
Tax History
| Year | Tax Paid | Tax Assessment Tax Assessment Total Assessment is a certain percentage of the fair market value that is determined by local assessors to be the total taxable value of land and additions on the property. | Land | Improvement |
|---|---|---|---|---|
| 2025 | $1,555 | $73,668 | $10,332 | $63,336 |
| 2024 | $1,553 | $73,668 | $10,332 | $63,336 |
| 2023 | $869 | $73,668 | $10,332 | $63,336 |
| 2022 | $1,620 | $56,628 | $10,332 | $46,296 |
| 2021 | $1,613 | $52,896 | $10,332 | $42,564 |
| 2020 | $1,614 | $52,896 | $10,332 | $42,564 |
| 2019 | $1,620 | $52,896 | $10,332 | $42,564 |
| 2018 | $1,620 | $52,896 | $10,332 | $42,564 |
| 2017 | $2,711 | $52,896 | $10,332 | $42,564 |
| 2016 | $2,722 | $80,400 | $10,800 | $69,600 |
| 2015 | $2,726 | $80,400 | $10,800 | $69,600 |
| 2014 | $2,730 | $80,400 | $10,800 | $69,600 |
| 2013 | -- | $80,400 | $10,800 | $69,600 |
Source: Public Records
Map
Nearby Homes