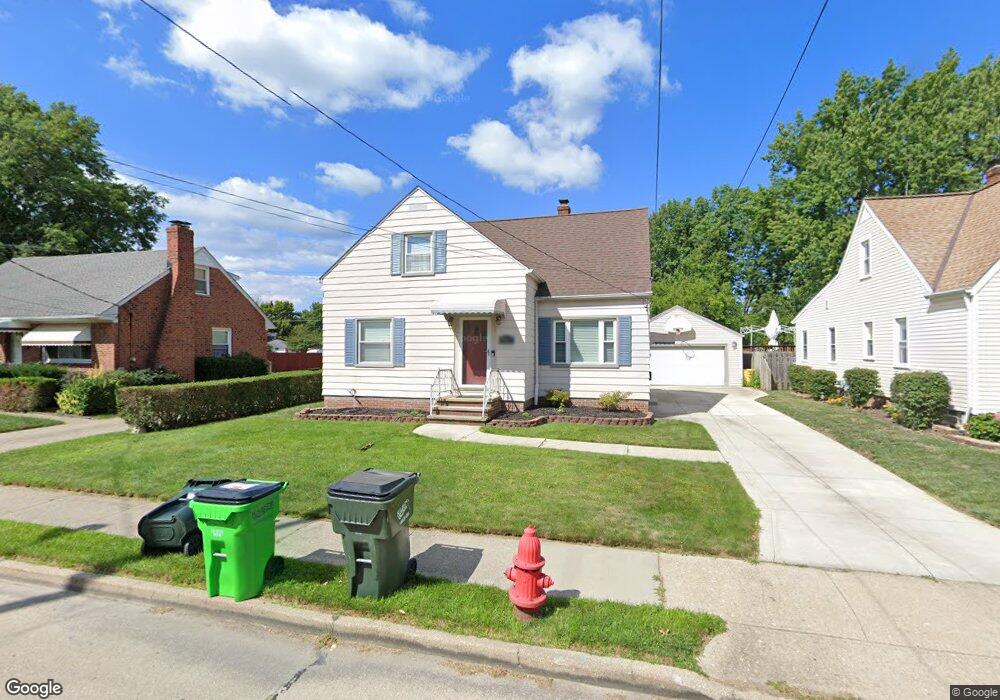
1540 Harding Dr Wickliffe, OH 44092
Estimated Value: $175,000 - $193,000
4
Beds
2
Baths
890
Sq Ft
$202/Sq Ft
Est. Value
About This Home
This home is located at 1540 Harding Dr, Wickliffe, OH 44092 and is currently estimated at $179,898, approximately $202 per square foot. 1540 Harding Dr is a home located in Lake County with nearby schools including Wickliffe Elementary School, Wickliffe Middle School, and Wickliffe High School.
Ownership History
Date
Name
Owned For
Owner Type
Purchase Details
Closed on
Jan 26, 2012
Sold by
Solema Nicholas J and Solema Melissa A
Bought by
Bartel Richard A
Current Estimated Value
Home Financials for this Owner
Home Financials are based on the most recent Mortgage that was taken out on this home.
Original Mortgage
$127,679
Outstanding Balance
$86,752
Interest Rate
3.87%
Mortgage Type
FHA
Estimated Equity
$93,146
Purchase Details
Closed on
May 5, 2005
Sold by
Miller Maureen C
Bought by
Solema Nicholas J and Solema Melissa A
Home Financials for this Owner
Home Financials are based on the most recent Mortgage that was taken out on this home.
Original Mortgage
$112,000
Interest Rate
6.05%
Mortgage Type
Purchase Money Mortgage
Purchase Details
Closed on
Jul 28, 1993
Bought by
Miller Maureen C
Create a Home Valuation Report for This Property
The Home Valuation Report is an in-depth analysis detailing your home's value as well as a comparison with similar homes in the area
Home Values in the Area
Average Home Value in this Area
Purchase History
| Date | Buyer | Sale Price | Title Company |
|---|---|---|---|
| Bartel Richard A | $131,000 | Progressive Land Title | |
| Solema Nicholas J | $140,000 | Enterprise Title | |
| Miller Maureen C | $87,000 | -- |
Source: Public Records
Mortgage History
| Date | Status | Borrower | Loan Amount |
|---|---|---|---|
| Open | Bartel Richard A | $127,679 | |
| Previous Owner | Solema Nicholas J | $112,000 |
Source: Public Records
Tax History Compared to Growth
Tax History
| Year | Tax Paid | Tax Assessment Tax Assessment Total Assessment is a certain percentage of the fair market value that is determined by local assessors to be the total taxable value of land and additions on the property. | Land | Improvement |
|---|---|---|---|---|
| 2024 | -- | $55,330 | $14,740 | $40,590 |
| 2023 | $2,672 | $37,500 | $12,750 | $24,750 |
| 2022 | $2,690 | $37,500 | $12,750 | $24,750 |
| 2021 | $2,701 | $37,500 | $12,750 | $24,750 |
| 2020 | $2,543 | $30,000 | $10,200 | $19,800 |
| 2019 | $2,542 | $30,000 | $10,200 | $19,800 |
| 2018 | $2,203 | $36,650 | $13,150 | $23,500 |
| 2017 | $2,580 | $36,650 | $13,150 | $23,500 |
| 2016 | $2,568 | $36,650 | $13,150 | $23,500 |
| 2015 | $2,522 | $36,650 | $13,150 | $23,500 |
| 2014 | $2,222 | $36,650 | $13,150 | $23,500 |
| 2013 | $2,221 | $36,650 | $13,150 | $23,500 |
Source: Public Records
Map
Nearby Homes
- 1560 Douglas Rd
- 34345 Giovanni Ave
- 1569 Douglas Rd
- 1648 Douglas Rd
- 5218 Liberty Ln Unit A
- 1590 Dennis Dr
- 5131 Liberty Ln Unit B
- 5084 Shepherds Glen
- 30335 Euclid Ave Unit 7
- 30335 Euclid Ave Unit 50
- 5082 Shepherds Glen
- 5080 Shepherds Glen
- 5078 Shepherds Glen
- 5076 Shepherds Glen
- 5074 Shepherds Glen
- 5068 Shepherds Glen
- 5085 Shepherds Glen
- 5062 Shepherds Glen
- 5083 Shepherds Glen
- 5081 Shepherds Glen
- 1704 Harding Dr
- 1534 Harding Dr
- 30571 Kerry Ln
- 1710 Harding Dr
- 1528 Harding Dr
- 1545 Harding Dr
- 1547 Harding Dr
- 1541 Harding Dr
- 1639 Harding Dr
- 1714 Harding Dr
- 1529 Harding Dr
- 1522 Harding Dr
- 30567 Kerry Ln
- 1715 Harding Dr
- 1544 Mapledale Rd
- 1540 Mapledale Rd
- 1548 Mapledale Rd
- 1536 Mapledale Rd
- 30563 Kerry Ln
- 1521 Harding Dr