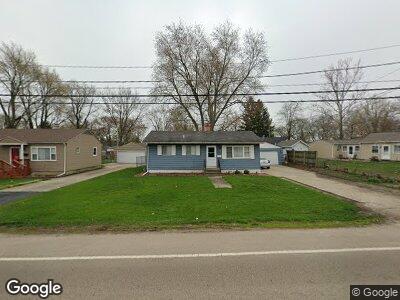
1540 Plum St Aurora, IL 60506
Edgelawn Randall NeighborhoodEstimated Value: $221,000 - $255,000
3
Beds
2
Baths
864
Sq Ft
$274/Sq Ft
Est. Value
About This Home
This home is located at 1540 Plum St, Aurora, IL 60506 and is currently estimated at $236,930, approximately $274 per square foot. 1540 Plum St is a home located in Kane County with nearby schools including Mccleery Elementary School, Jefferson Middle School, and West Aurora High School.
Ownership History
Date
Name
Owned For
Owner Type
Purchase Details
Closed on
Mar 29, 2013
Sold by
Kennedy Meghan
Bought by
Ruiz Francisco and Ruiz Croz
Current Estimated Value
Home Financials for this Owner
Home Financials are based on the most recent Mortgage that was taken out on this home.
Original Mortgage
$63,822
Interest Rate
3.87%
Mortgage Type
FHA
Purchase Details
Closed on
Oct 30, 2006
Sold by
Dixon Dwight M
Bought by
Kennedy Meghan
Home Financials for this Owner
Home Financials are based on the most recent Mortgage that was taken out on this home.
Original Mortgage
$132,000
Interest Rate
6.75%
Mortgage Type
Purchase Money Mortgage
Purchase Details
Closed on
Oct 27, 2006
Sold by
Deutsche Bank National Trust Co
Bought by
Dixon Dwight M
Home Financials for this Owner
Home Financials are based on the most recent Mortgage that was taken out on this home.
Original Mortgage
$132,000
Interest Rate
6.75%
Mortgage Type
Purchase Money Mortgage
Create a Home Valuation Report for This Property
The Home Valuation Report is an in-depth analysis detailing your home's value as well as a comparison with similar homes in the area
Home Values in the Area
Average Home Value in this Area
Purchase History
| Date | Buyer | Sale Price | Title Company |
|---|---|---|---|
| Ruiz Francisco | $65,000 | Chicago Title Insurance Comp | |
| Kennedy Meghan | $165,000 | Greater Illinois Title Co | |
| Dixon Dwight M | -- | Greater Illinois Title Co |
Source: Public Records
Mortgage History
| Date | Status | Borrower | Loan Amount |
|---|---|---|---|
| Previous Owner | Ruiz Francisco | $63,822 | |
| Previous Owner | Kennedy Meghan | $132,000 | |
| Previous Owner | Dixon Dwight M | $33,000 |
Source: Public Records
Tax History Compared to Growth
Tax History
| Year | Tax Paid | Tax Assessment Tax Assessment Total Assessment is a certain percentage of the fair market value that is determined by local assessors to be the total taxable value of land and additions on the property. | Land | Improvement |
|---|---|---|---|---|
| 2023 | $4,309 | $58,303 | $9,917 | $48,386 |
| 2022 | $4,178 | $53,196 | $9,048 | $44,148 |
| 2021 | $3,977 | $49,526 | $8,424 | $41,102 |
| 2020 | $3,745 | $46,003 | $7,825 | $38,178 |
| 2019 | $3,581 | $42,623 | $7,250 | $35,373 |
| 2018 | $3,230 | $38,357 | $6,706 | $31,651 |
| 2017 | $3,349 | $38,540 | $6,179 | $32,361 |
| 2016 | $3,560 | $39,512 | $5,297 | $34,215 |
| 2015 | -- | $34,739 | $4,555 | $30,184 |
| 2014 | -- | $32,337 | $4,186 | $28,151 |
| 2013 | -- | $32,743 | $4,126 | $28,617 |
Source: Public Records
Map
Nearby Homes
- 1677 Brightwood Place Unit 8B
- 1515 W Galena Blvd
- 1730 W Galena Blvd Unit 402E
- 3 S Calumet Ave
- 1315 W Galena Blvd
- 1731 Garfield Ave
- 115 S Calumet Ave
- 831 N Glenwood Place
- 156 S Western Ave
- 1311 Monomoy St Unit A
- 1963 W Illinois Ave Unit 69
- 1357 Monomoy St Unit B1
- 80 Barn Swallow Ct
- 1102 W Galena Blvd
- 1381 N Glen Cir Unit D
- 1301 N Glen Cir Unit D
- 70 S Commonwealth Ave
- 1351 N Glen Cir Unit A
- 232 S Randall Rd
- 1045 Garfield Ave
- 1540 Plum St
- 1538 Plum St
- 309 Westgate Dr
- 319 Westgate Dr
- 303 Westgate Dr
- 322 N Buell Ave
- 316 N Buell Ave
- 239 Westgate Dr
- 1539 Plum St
- 312 N Buell Ave
- 500 N Buell Ave
- 233 Westgate Dr
- 316 Westgate Dr
- 308 N Buell Ave
- 322 Westgate Dr
- 312 Westgate Dr
- 308 Westgate Dr
- 511 N Western Ave
- 222 N Western Ave
- 505 Westgate Dr