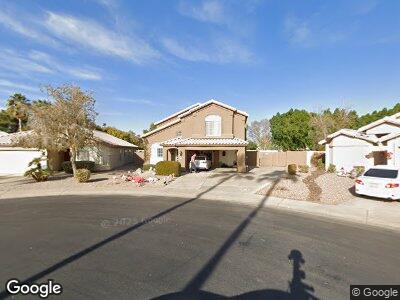
1540 W Megan St Chandler, AZ 85224
Central Ridge NeighborhoodEstimated Value: $512,982 - $627,000
--
Bed
3
Baths
2,103
Sq Ft
$276/Sq Ft
Est. Value
About This Home
This home is located at 1540 W Megan St, Chandler, AZ 85224 and is currently estimated at $580,496, approximately $276 per square foot. 1540 W Megan St is a home located in Maricopa County with nearby schools including Hartford Sylvia Encinas Elementary School, Andersen Junior High School, and Chandler High School.
Ownership History
Date
Name
Owned For
Owner Type
Purchase Details
Closed on
Aug 1, 2013
Sold by
Lacelle Kenneth and La Celle Paula
Bought by
Lacelle Kenneth J and Lacelle Paula La
Current Estimated Value
Purchase Details
Closed on
Jun 28, 2000
Sold by
Yosten Tony and Yosten Shyla
Bought by
Lacelle Kenneth and Cartright Paula
Home Financials for this Owner
Home Financials are based on the most recent Mortgage that was taken out on this home.
Original Mortgage
$136,000
Interest Rate
8.37%
Mortgage Type
New Conventional
Purchase Details
Closed on
May 23, 1997
Sold by
Snodgrass Robert and Snodgrass Roxanne
Bought by
Yosten Tony and Yosten Shyla
Home Financials for this Owner
Home Financials are based on the most recent Mortgage that was taken out on this home.
Original Mortgage
$143,450
Interest Rate
8.14%
Mortgage Type
New Conventional
Purchase Details
Closed on
May 16, 1994
Sold by
Hamann Michael L and Hamann Tracy S
Bought by
Snodgrass Robert and Snodgrass Roxanne
Create a Home Valuation Report for This Property
The Home Valuation Report is an in-depth analysis detailing your home's value as well as a comparison with similar homes in the area
Home Values in the Area
Average Home Value in this Area
Purchase History
| Date | Buyer | Sale Price | Title Company |
|---|---|---|---|
| Lacelle Kenneth J | -- | None Available | |
| Lacelle Kenneth | $170,000 | First American Title | |
| Yosten Tony | $151,000 | First Title Agency | |
| Snodgrass Robert | $119,000 | First Southwestern Title |
Source: Public Records
Mortgage History
| Date | Status | Borrower | Loan Amount |
|---|---|---|---|
| Open | Lacelle Keneth J | $121,727 | |
| Closed | Lacelle Kenneth | $136,000 | |
| Previous Owner | Yosten Tony | $143,450 |
Source: Public Records
Tax History Compared to Growth
Tax History
| Year | Tax Paid | Tax Assessment Tax Assessment Total Assessment is a certain percentage of the fair market value that is determined by local assessors to be the total taxable value of land and additions on the property. | Land | Improvement |
|---|---|---|---|---|
| 2025 | $2,105 | $27,393 | -- | -- |
| 2024 | $2,061 | $26,088 | -- | -- |
| 2023 | $2,061 | $42,910 | $8,580 | $34,330 |
| 2022 | $1,989 | $31,570 | $6,310 | $25,260 |
| 2021 | $2,084 | $30,700 | $6,140 | $24,560 |
| 2020 | $2,075 | $29,630 | $5,920 | $23,710 |
| 2019 | $1,996 | $26,720 | $5,340 | $21,380 |
| 2018 | $1,932 | $24,930 | $4,980 | $19,950 |
| 2017 | $1,801 | $23,810 | $4,760 | $19,050 |
| 2016 | $1,735 | $23,330 | $4,660 | $18,670 |
| 2015 | $1,681 | $21,860 | $4,370 | $17,490 |
Source: Public Records
Map
Nearby Homes
- 1257 W Dublin St
- 790 N Meadows Dr
- 1825 W Ray Rd Unit 1119
- 1825 W Ray Rd Unit 1070
- 1825 W Ray Rd Unit 1134
- 1825 W Ray Rd Unit 2132
- 1825 W Ray Rd Unit 2111
- 1825 W Ray Rd Unit 2074
- 1825 W Ray Rd Unit 2092
- 1825 W Ray Rd Unit 2123
- 1825 W Ray Rd Unit 1063
- 1825 W Ray Rd Unit 1068
- 1825 W Ray Rd Unit 1058
- 1825 W Ray Rd Unit 1148
- 1825 W Ray Rd Unit 2060
- 1825 W Ray Rd Unit 1001
- 1540 W Orchid Ln
- 1720 W Orchid Ln
- 741 N Cholla St
- 1731 W Del Rio St
- 1540 W Megan St
- 991 N Longmore St
- 1550 W Megan St
- 1560 W Megan St
- 981 N Longmore St
- 1570 W Megan St
- 971 N Longmore St
- 1551 W Megan St
- 1561 W Megan St
- 1580 W Megan St
- 961 N Longmore St
- 1426 W Megan St
- 1571 W Megan St
- 950 N Longmore St
- 1581 W Megan St
- 1021 N Longmore St
- 1424 W Megan St
- 1015 N Longmore St
- 940 N Longmore St
- 1425 W Megan St