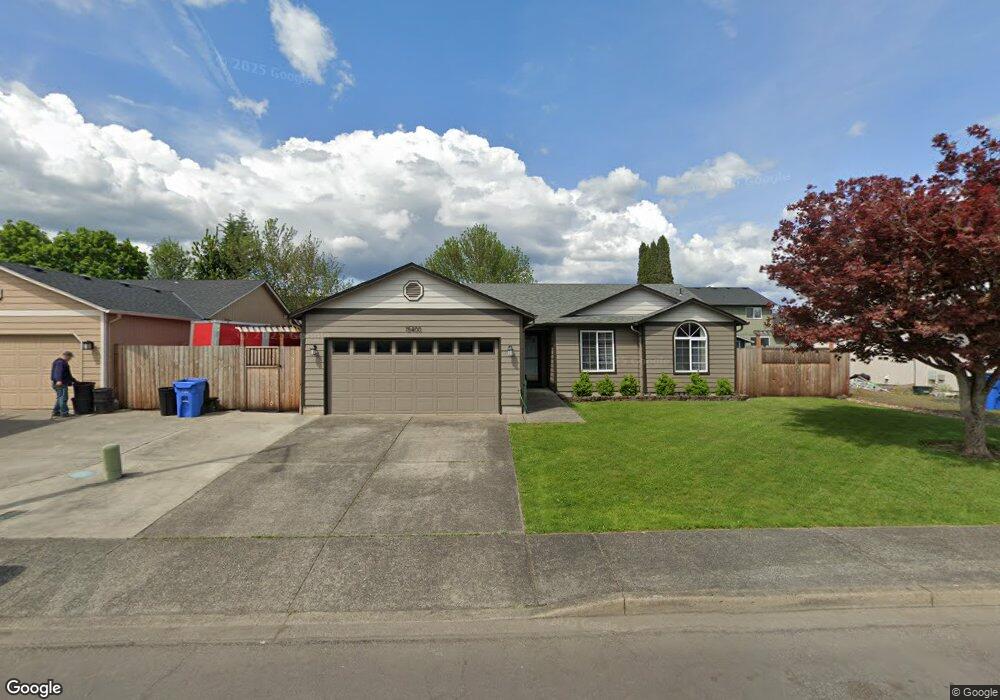
15400 NE 88th St Vancouver, WA 98682
Orchards Area NeighborhoodEstimated Value: $449,000 - $488,000
3
Beds
3
Baths
1,386
Sq Ft
$340/Sq Ft
Est. Value
About This Home
This home is located at 15400 NE 88th St, Vancouver, WA 98682 and is currently estimated at $470,619, approximately $339 per square foot. 15400 NE 88th St is a home located in Clark County with nearby schools including York Elementary School, Frontier Middle School, and Heritage High School.
Ownership History
Date
Name
Owned For
Owner Type
Purchase Details
Closed on
Mar 31, 2015
Sold by
Patterson Joseph R and Pattesron Tami Lynn
Bought by
Dodson John T and Dodson Jennifer L
Current Estimated Value
Home Financials for this Owner
Home Financials are based on the most recent Mortgage that was taken out on this home.
Original Mortgage
$206,196
Outstanding Balance
$162,998
Interest Rate
4.5%
Mortgage Type
FHA
Estimated Equity
$307,621
Purchase Details
Closed on
Dec 10, 2003
Sold by
Washington Andre E and Washington Alba
Bought by
Patterson Joseph R and Patterson Tami Lyn
Purchase Details
Closed on
Aug 26, 1998
Sold by
Country Lane Acres Lp
Bought by
Washington Andre E
Home Financials for this Owner
Home Financials are based on the most recent Mortgage that was taken out on this home.
Original Mortgage
$125,100
Interest Rate
6.91%
Create a Home Valuation Report for This Property
The Home Valuation Report is an in-depth analysis detailing your home's value as well as a comparison with similar homes in the area
Home Values in the Area
Average Home Value in this Area
Purchase History
| Date | Buyer | Sale Price | Title Company |
|---|---|---|---|
| Dodson John T | $209,719 | First American Title | |
| Patterson Joseph R | $148,900 | Fidelity National Title | |
| Washington Andre E | $131,687 | Chicago Title Insurance Co |
Source: Public Records
Mortgage History
| Date | Status | Borrower | Loan Amount |
|---|---|---|---|
| Open | Dodson John T | $206,196 | |
| Previous Owner | Washington Andre E | $125,100 |
Source: Public Records
Tax History Compared to Growth
Tax History
| Year | Tax Paid | Tax Assessment Tax Assessment Total Assessment is a certain percentage of the fair market value that is determined by local assessors to be the total taxable value of land and additions on the property. | Land | Improvement |
|---|---|---|---|---|
| 2025 | $4,183 | $416,424 | $180,900 | $235,524 |
| 2024 | $4,084 | $411,387 | $180,900 | $230,487 |
| 2023 | $4,076 | $421,972 | $180,900 | $241,072 |
| 2022 | $3,762 | $414,786 | $180,900 | $233,886 |
| 2021 | $3,467 | $356,558 | $155,601 | $200,957 |
| 2020 | $3,162 | $308,987 | $135,000 | $173,987 |
| 2019 | $2,874 | $282,577 | $123,750 | $158,827 |
| 2018 | $3,183 | $277,194 | $0 | $0 |
| 2017 | $2,417 | $247,884 | $0 | $0 |
| 2016 | $2,517 | $195,042 | $0 | $0 |
| 2015 | $2,506 | $189,571 | $0 | $0 |
| 2014 | -- | $179,802 | $0 | $0 |
| 2013 | -- | $168,644 | $0 | $0 |
Source: Public Records
Map
Nearby Homes
- 15520 NE 87th St
- 15107 NE 91st St
- 9008 NE 158th Ave
- 15415 NE 85th St
- 9109 NE 151st Ct
- 15009 NE 91st St
- 17309 NE 84th St
- 15813 NE 87th Cir
- 14911 NE 86th St
- 9214 NE 159th Ave
- 16001 NE 90th St
- 15208 NE 96th St
- 14719 NE 85th Cir Unit 3
- 9611 NE 152nd Ave
- 8008 NE 151st Ct
- 9811 NE 152nd Ave
- 15209 NE 99th Cir
- 7813 NE 152nd Ave
- 14400 NE 90th St
- 7817 NE 152nd Ave
- 15404 NE 88th St
- 15322 NE 88th St
- 15401 NE 89th St
- 15405 NE 89th St
- 15325 NE 89th St
- 15408 NE 88th St
- 15318 NE 88th St
- 15401 NE 88th St
- 15321 NE 88th St
- 15405 NE 88th St
- 15321 NE 89th St
- 15409 NE 89th St
- 15317 NE 88th St
- 15409 NE 88th St
- 15412 NE 88th St
- 15317 NE 89th St
- 15413 NE 89th St
- 15400 NE 89th St
- 15402 NE 87th St
- 15316 NE 89th St