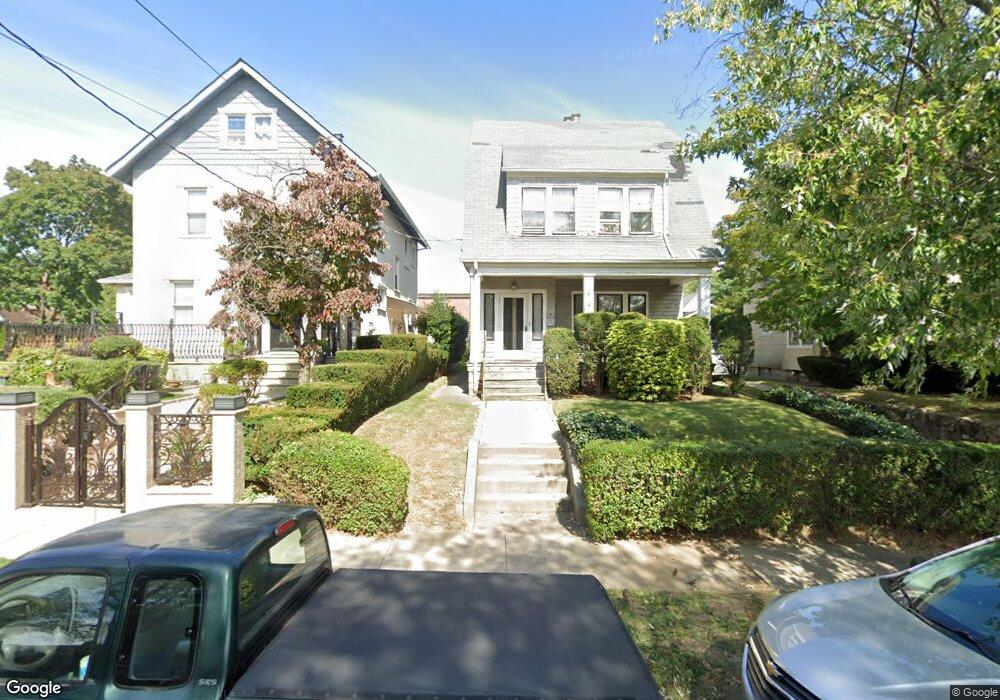
15401 Beech Ave Flushing, NY 11355
East Flushing NeighborhoodEstimated Value: $1,353,159 - $1,629,000
Studio
--
Bath
2,216
Sq Ft
$697/Sq Ft
Est. Value
About This Home
This home is located at 15401 Beech Ave, Flushing, NY 11355 and is currently estimated at $1,544,790, approximately $697 per square foot. 15401 Beech Ave is a home located in Queens County with nearby schools including P.S. 22 - Thomas Jefferson, J.H.S. 189Q Daniel Carter Beard, and Francis Lewis High School.
Ownership History
Date
Name
Owned For
Owner Type
Purchase Details
Closed on
Jan 20, 2006
Sold by
Choe Moon and Choe Peter
Bought by
Liu Andrew and Liu David
Current Estimated Value
Home Financials for this Owner
Home Financials are based on the most recent Mortgage that was taken out on this home.
Original Mortgage
$186,000
Outstanding Balance
$104,192
Interest Rate
6.31%
Estimated Equity
$1,440,598
Purchase Details
Closed on
Feb 14, 2005
Sold by
Ho Ching-Chiang and Ho Eric Wei-Huang
Bought by
Choe Moon and Choe Peter
Home Financials for this Owner
Home Financials are based on the most recent Mortgage that was taken out on this home.
Original Mortgage
$521,250
Interest Rate
5.73%
Mortgage Type
Purchase Money Mortgage
Purchase Details
Closed on
Jun 23, 2003
Sold by
Ho Ching-Chiang and Ho Fang-Mei
Bought by
Ho Ching-Chiang and Ho Eric Wei-Huang
Home Financials for this Owner
Home Financials are based on the most recent Mortgage that was taken out on this home.
Original Mortgage
$171,300
Interest Rate
5.69%
Mortgage Type
Purchase Money Mortgage
Create a Home Valuation Report for This Property
The Home Valuation Report is an in-depth analysis detailing your home's value as well as a comparison with similar homes in the area
Home Values in the Area
Average Home Value in this Area
Purchase History
| Date | Buyer | Sale Price | Title Company |
|---|---|---|---|
| Liu Andrew | $930,000 | -- | |
| Liu Andrew | $930,000 | -- | |
| Choe Moon | $695,000 | -- | |
| Choe Moon | $695,000 | -- | |
| Ho Ching-Chiang | -- | -- | |
| Ho Ching-Chiang | -- | -- |
Source: Public Records
Mortgage History
| Date | Status | Borrower | Loan Amount |
|---|---|---|---|
| Open | Liu Andrew | $186,000 | |
| Closed | Liu Andrew | $186,000 | |
| Open | Liu Andrew | $697,500 | |
| Closed | Liu Andrew | $697,500 | |
| Previous Owner | Choe Moon | $521,250 | |
| Previous Owner | Ho Ching-Chiang | $171,300 |
Source: Public Records
Tax History
| Year | Tax Paid | Tax Assessment Tax Assessment Total Assessment is a certain percentage of the fair market value that is determined by local assessors to be the total taxable value of land and additions on the property. | Land | Improvement |
|---|---|---|---|---|
| 2025 | $11,017 | $54,851 | $12,915 | $41,936 |
| 2024 | $11,017 | $54,851 | $13,646 | $41,205 |
| 2023 | $10,527 | $52,412 | $12,479 | $39,933 |
| 2022 | $9,427 | $87,180 | $21,600 | $65,580 |
| 2021 | $10,197 | $81,960 | $21,600 | $60,360 |
| 2020 | $9,675 | $83,940 | $21,600 | $62,340 |
| 2019 | $9,562 | $77,760 | $21,600 | $56,160 |
| 2018 | $8,904 | $43,677 | $16,999 | $26,678 |
| 2017 | $8,466 | $41,529 | $14,459 | $27,070 |
| 2016 | $8,072 | $41,529 | $14,459 | $27,070 |
| 2015 | $4,725 | $38,091 | $17,862 | $20,229 |
| 2014 | $4,725 | $38,091 | $18,225 | $19,866 |
Source: Public Records
Map
Nearby Homes
- 154-21 Ash Ave
- 42-36 156th St
- 149-63 Ash Ave
- 155-17 Sanford Ave Unit E
- 155-17 Sanford Ave Unit 6D
- 155-17 Sanford Ave Unit 6A
- 155-17 Sanford Ave Unit 2F
- 149-36 Ash Ave
- 43-23 156th St
- 42-20 158th St
- 4304 158th St Unit L4
- 4304 158th St Unit 2C
- 43-04 158th St Unit 3E
- 150-23 Barclay Ave Unit 4H
- 150-23 Barclay Ave Unit 5A
- 42-28 159th St
- 14917 Sanford Ave Unit 4A
- 4307 149th St
- 40-11 157th St
- 40-25 158th St
- 15405 Beech Ave
- 154-05 Beech Ave
- 4243 Murray St
- 15411 Beech Ave
- 42-39 Murray St
- 42-39 Ash Ave
- 15410 Ash Ave
- 15404 Beech Ave
- 154-04 Beech Ave
- 4250 Murray St
- 15410 Ash Ave
- 42-35 Murray St
- 4235 Murray St
- 15414 Ash Ave
- 15417 Beech Ave
- 15417 Beech Ave
- 4244 Murray St
- 4252 Murray St
- 4267 Murray St
- 4267 Murray St
Your Personal Tour Guide
Ask me questions while you tour the home.