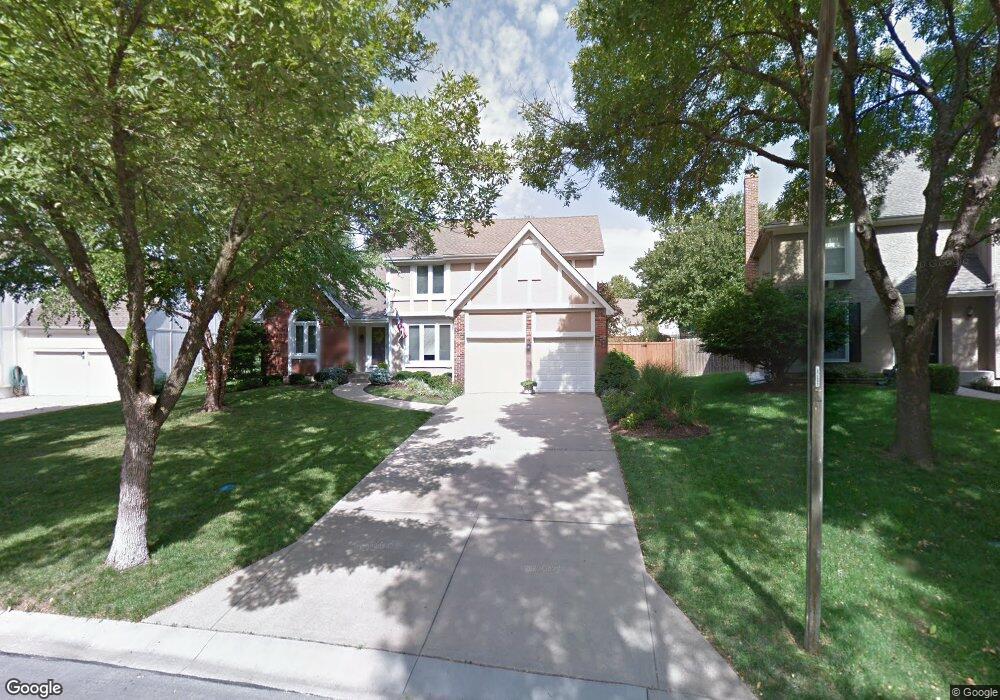
15404 W 92nd Place Lenexa, KS 66219
Estimated Value: $417,000 - $493,000
4
Beds
3
Baths
2,388
Sq Ft
$192/Sq Ft
Est. Value
About This Home
This home is located at 15404 W 92nd Place, Lenexa, KS 66219 and is currently estimated at $458,618, approximately $192 per square foot. 15404 W 92nd Place is a home located in Johnson County with nearby schools including Sunflower Elementary School, Westridge Middle School, and Shawnee Mission West High School.
Ownership History
Date
Name
Owned For
Owner Type
Purchase Details
Closed on
Jul 27, 2018
Sold by
Lovell Rex and Lovell Theresa
Bought by
Porter Joel and Porter Amanda
Current Estimated Value
Home Financials for this Owner
Home Financials are based on the most recent Mortgage that was taken out on this home.
Original Mortgage
$200,000
Outstanding Balance
$173,354
Interest Rate
4.6%
Mortgage Type
New Conventional
Estimated Equity
$285,264
Purchase Details
Closed on
May 17, 2016
Sold by
Lovell Rex A and Lovell Theresa L
Bought by
Lovell Rex A and Lovell Theresa
Purchase Details
Closed on
Mar 8, 2010
Sold by
Shelby Jo Ellen and Shelby Raymond S
Bought by
Lovell Rex A and Lovell Theresa L
Home Financials for this Owner
Home Financials are based on the most recent Mortgage that was taken out on this home.
Original Mortgage
$193,200
Interest Rate
4.97%
Mortgage Type
New Conventional
Create a Home Valuation Report for This Property
The Home Valuation Report is an in-depth analysis detailing your home's value as well as a comparison with similar homes in the area
Home Values in the Area
Average Home Value in this Area
Purchase History
| Date | Buyer | Sale Price | Title Company |
|---|---|---|---|
| Porter Joel | -- | Continental Title | |
| Lovell Rex A | -- | None Available | |
| Lovell Rex A | -- | Chicago Title Ins Co |
Source: Public Records
Mortgage History
| Date | Status | Borrower | Loan Amount |
|---|---|---|---|
| Open | Porter Joel | $200,000 | |
| Previous Owner | Lovell Rex A | $193,200 |
Source: Public Records
Tax History Compared to Growth
Tax History
| Year | Tax Paid | Tax Assessment Tax Assessment Total Assessment is a certain percentage of the fair market value that is determined by local assessors to be the total taxable value of land and additions on the property. | Land | Improvement |
|---|---|---|---|---|
| 2024 | $5,512 | $49,761 | $8,040 | $41,721 |
| 2023 | $5,364 | $47,667 | $7,660 | $40,007 |
| 2022 | $4,838 | $42,952 | $7,292 | $35,660 |
| 2021 | $4,533 | $38,226 | $6,946 | $31,280 |
| 2020 | $4,380 | $36,559 | $6,943 | $29,616 |
| 2019 | $4,238 | $35,351 | $6,041 | $29,310 |
| 2018 | $4,255 | $35,190 | $5,495 | $29,695 |
| 2017 | $4,290 | $34,408 | $4,998 | $29,410 |
| 2016 | $3,974 | $31,453 | $4,998 | $26,455 |
| 2015 | $3,829 | $30,510 | $4,998 | $25,512 |
| 2013 | -- | $27,232 | $4,998 | $22,234 |
Source: Public Records
Map
Nearby Homes
- 15320 W 92nd Place
- 9124 Constance St
- 9207 Boehm Dr
- 9203 Boehm Dr
- 9131 Darnell St
- 15920 W 91st Terrace
- 8946 Country Hill Ct
- 9318 Greenway Ln
- 9202 Greenway Ln
- 8919 Greenway Ln
- 9029 Acuff Ln
- 15611 W 86th St
- 8616 Baska Ct
- 8641 Greenwood Ln
- 14101 W 88th Place
- 15710 W 84th Terrace
- 8403 Swarner Dr
- 15529 W 83rd Terrace
- 14915 W 84th Terrace
- 14424 W 84th Terrace
- 15410 W 92nd Place
- 15326 W 92nd Place
- 15416 W 92nd Place
- 9141 Hall Dr
- 9139 Hall Dr
- 15405 W 92nd Place
- 15422 W 92nd Place
- 15314 W 92nd Place
- 9201 Tomashaw Ln
- 15413 W 92nd Place
- 15319 W 92nd Place
- 9239 Twilight Ln
- 15323 W 91st Place
- 9135 Hall Dr
- 9134 Twilight Ln
- 9140 Hall Dr
- 15428 W 92nd Place
- 9226 Woodstone St
- 15308 W 92nd Place
- 9149 Tomashaw St