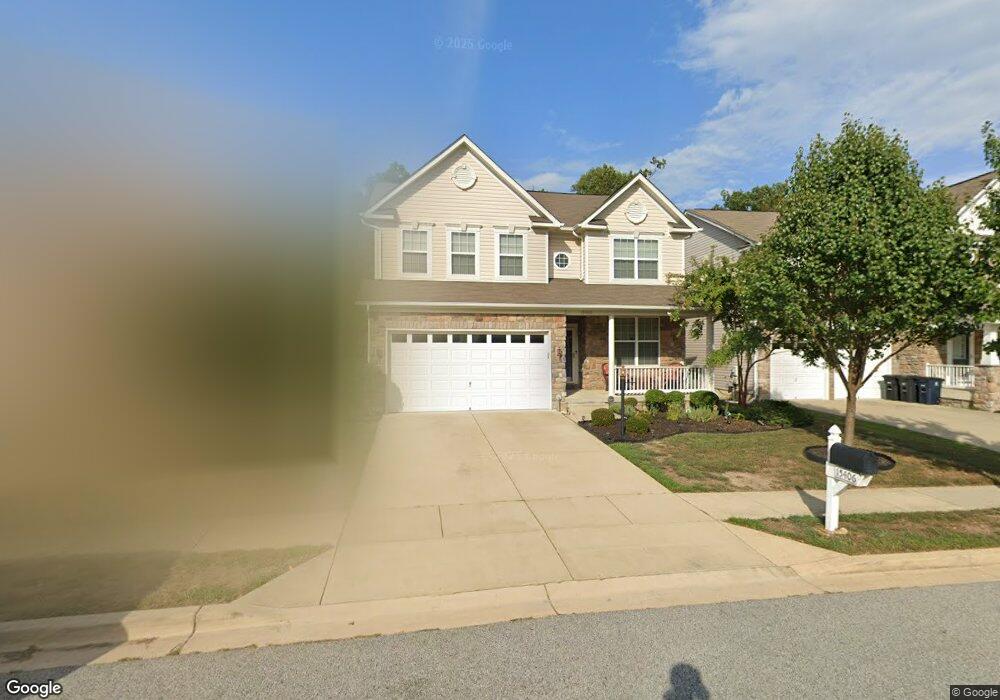
15406 Pulaski Rd Unit BM3005 Brandywine, MD 20613
Estimated Value: $561,528 - $641,000
4
Beds
5
Baths
2,867
Sq Ft
$211/Sq Ft
Est. Value
About This Home
This home is located at 15406 Pulaski Rd Unit BM3005, Brandywine, MD 20613 and is currently estimated at $604,132, approximately $210 per square foot. 15406 Pulaski Rd Unit BM3005 is a home located in Prince George's County with nearby schools including Brandywine Elementary School, Gwynn Park Middle School, and Gwynn Park High School.
Ownership History
Date
Name
Owned For
Owner Type
Purchase Details
Closed on
Sep 3, 2020
Sold by
Hawkins Shynita Vashelle and Williams Shynita V
Bought by
Hawkins Shynita Vashelle and Hawkins Daryl Leon
Current Estimated Value
Purchase Details
Closed on
May 31, 2018
Sold by
Peteet James A
Bought by
Williams Shynita V
Home Financials for this Owner
Home Financials are based on the most recent Mortgage that was taken out on this home.
Original Mortgage
$368,207
Outstanding Balance
$320,394
Interest Rate
4.87%
Mortgage Type
FHA
Estimated Equity
$283,738
Purchase Details
Closed on
May 27, 2011
Sold by
K Hovnanian Homes Of Maryland Llc
Bought by
Peteet James A
Home Financials for this Owner
Home Financials are based on the most recent Mortgage that was taken out on this home.
Original Mortgage
$340,000
Interest Rate
4.81%
Mortgage Type
VA
Create a Home Valuation Report for This Property
The Home Valuation Report is an in-depth analysis detailing your home's value as well as a comparison with similar homes in the area
Home Values in the Area
Average Home Value in this Area
Purchase History
| Date | Buyer | Sale Price | Title Company |
|---|---|---|---|
| Hawkins Shynita Vashelle | -- | Accommodation | |
| Williams Shynita V | $375,000 | Michaels Title And Escrow Ll | |
| Peteet James A | $340,000 | Founders Title Agency Of Mar |
Source: Public Records
Mortgage History
| Date | Status | Borrower | Loan Amount |
|---|---|---|---|
| Open | Williams Shynita V | $368,207 | |
| Previous Owner | Peteet James A | $340,000 |
Source: Public Records
Tax History
| Year | Tax Paid | Tax Assessment Tax Assessment Total Assessment is a certain percentage of the fair market value that is determined by local assessors to be the total taxable value of land and additions on the property. | Land | Improvement |
|---|---|---|---|---|
| 2025 | $7,503 | $563,500 | $125,100 | $438,400 |
| 2024 | $7,503 | $515,667 | -- | -- |
| 2023 | $7,153 | $467,833 | $0 | $0 |
| 2022 | $6,463 | $420,000 | $100,100 | $319,900 |
| 2021 | $6,216 | $402,933 | $0 | $0 |
| 2020 | $11,939 | $385,867 | $0 | $0 |
| 2019 | $5,281 | $368,800 | $100,000 | $268,800 |
| 2018 | $5,598 | $360,133 | $0 | $0 |
| 2017 | $5,250 | $351,467 | $0 | $0 |
| 2016 | -- | $342,800 | $0 | $0 |
| 2015 | $4,353 | $333,000 | $0 | $0 |
| 2014 | $4,353 | $323,200 | $0 | $0 |
Source: Public Records
Map
Nearby Homes
- 15407 Pulaski Rd
- 15511 Wylie Rd
- 15407 Gideon Gilpin St
- 7024 Commander Howe Terrace
- 15420 Kennett Square Way
- 15622 Chadsey Ln
- 7005 Chadds Ford Dr
- 15411 Chaddsford Lake Dr
- 7130 Britens Way
- 7407 Four Gardens Rd
- 15440 General Lafayette Blvd
- 15012 General Lafayette Blvd
- 15005 Douglas Fir Ln
- 15001 Douglas Fir Ln
- 7424 Calm Retreat Blvd
- 7414 Calm Retreat Blvd
- 7404 Calm Retreat Blvd
- 14934 Ring House Rd
- 14910 Townshend Terrace Ave
- 14801 Mattawoman Dr
- 15406 Pulaski Rd
- 15404 Pulaski Rd
- 15404 Pulaski Rd Unit BM3006
- 15408 Pulaski Rd
- 15402 Pulaski Rd
- 15410 Pulaski Rd
- 15405 Pulaski Rd
- 15400 Pulaski Rd
- 15412 Pulaski Rd
- 15403 Pulaski Rd
- 15409 Pulaski Rd
- 15414 Pulaski Rd
- 15411 Pulaski Rd
- 7104 Mad Anthony Ct
- 15413 Pulaski Rd
- 7102 Mad Anthony Ct
- 7100 Mad Anthony Ct
- 15415 Pulaski Rd
- 7107 Mad Anthony Ct
- 7110 Beissel Ct
Your Personal Tour Guide
Ask me questions while you tour the home.