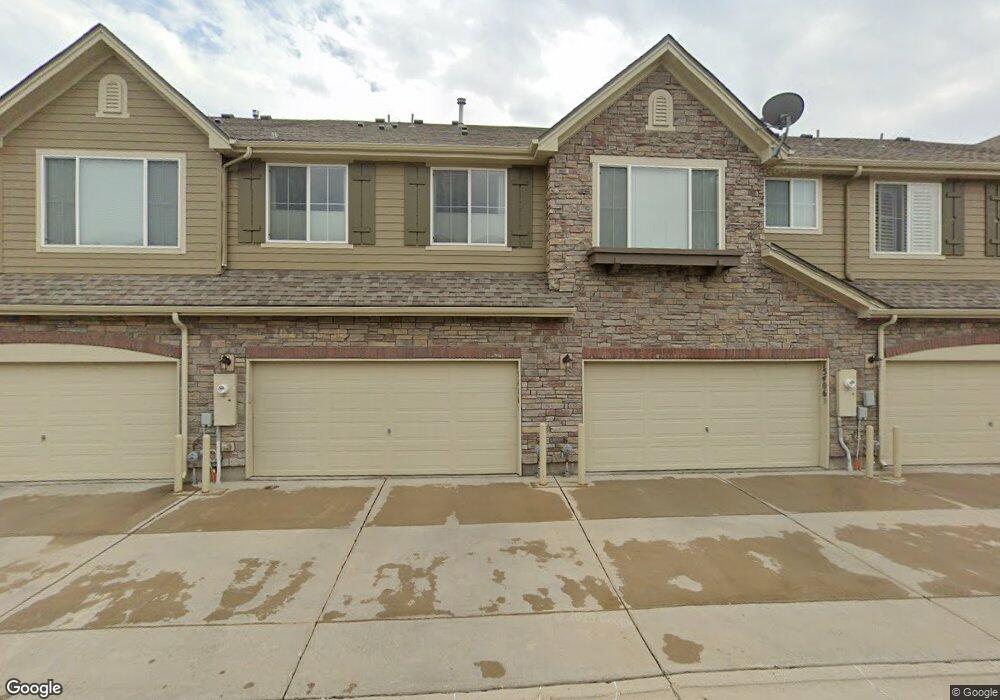
15406 W 66th Dr Unit B Arvada, CO 80007
Ralston Valley NeighborhoodEstimated Value: $487,000 - $540,118
2
Beds
3
Baths
1,525
Sq Ft
$344/Sq Ft
Est. Value
About This Home
This home is located at 15406 W 66th Dr Unit B, Arvada, CO 80007 and is currently estimated at $524,030, approximately $343 per square foot. 15406 W 66th Dr Unit B is a home located in Jefferson County with nearby schools including Stott Elementary School, Drake Junior High School, and Arvada West High School.
Ownership History
Date
Name
Owned For
Owner Type
Purchase Details
Closed on
Jun 26, 2014
Sold by
Nabiyar Jahed and Faied Maroya M
Bought by
Ross Gina M
Current Estimated Value
Home Financials for this Owner
Home Financials are based on the most recent Mortgage that was taken out on this home.
Original Mortgage
$198,400
Outstanding Balance
$151,517
Interest Rate
4.23%
Mortgage Type
New Conventional
Estimated Equity
$372,513
Purchase Details
Closed on
Apr 26, 2012
Sold by
Roluti Michael John
Bought by
Faied Maroya M and Nabiyar Jahed
Home Financials for this Owner
Home Financials are based on the most recent Mortgage that was taken out on this home.
Original Mortgage
$218,500
Interest Rate
3.97%
Mortgage Type
New Conventional
Purchase Details
Closed on
Oct 15, 2008
Sold by
Hometown Llc
Bought by
Roluti Michael John
Home Financials for this Owner
Home Financials are based on the most recent Mortgage that was taken out on this home.
Original Mortgage
$207,900
Interest Rate
6%
Mortgage Type
Purchase Money Mortgage
Create a Home Valuation Report for This Property
The Home Valuation Report is an in-depth analysis detailing your home's value as well as a comparison with similar homes in the area
Home Values in the Area
Average Home Value in this Area
Purchase History
| Date | Buyer | Sale Price | Title Company |
|---|---|---|---|
| Ross Gina M | $248,000 | Land Title Guarantee Company | |
| Faied Maroya M | $230,000 | Fidelity National Title Ins | |
| Roluti Michael John | $231,006 | Security Title |
Source: Public Records
Mortgage History
| Date | Status | Borrower | Loan Amount |
|---|---|---|---|
| Open | Ross Gina M | $198,400 | |
| Previous Owner | Faied Maroya M | $218,500 | |
| Previous Owner | Roluti Michael John | $207,900 |
Source: Public Records
Tax History Compared to Growth
Tax History
| Year | Tax Paid | Tax Assessment Tax Assessment Total Assessment is a certain percentage of the fair market value that is determined by local assessors to be the total taxable value of land and additions on the property. | Land | Improvement |
|---|---|---|---|---|
| 2024 | $3,773 | $28,780 | $6,030 | $22,750 |
| 2023 | $3,773 | $28,780 | $6,030 | $22,750 |
| 2022 | $3,090 | $24,155 | $4,170 | $19,985 |
| 2021 | $3,150 | $24,850 | $4,290 | $20,560 |
| 2020 | $3,091 | $24,436 | $4,290 | $20,146 |
| 2019 | $3,059 | $24,436 | $4,290 | $20,146 |
| 2018 | $3,213 | $24,175 | $3,600 | $20,575 |
| 2017 | $3,013 | $24,175 | $3,600 | $20,575 |
| 2016 | $2,883 | $22,153 | $4,776 | $17,377 |
| 2015 | $2,461 | $22,153 | $4,776 | $17,377 |
| 2014 | $2,461 | $17,425 | $2,229 | $15,196 |
Source: Public Records
Map
Nearby Homes
- 15516 W 66th Dr Unit A
- 15496 W 66th Dr Unit C
- 15296 W 66th Dr Unit G
- 15233 W 65th Ave Unit C
- 15492 W 65th Ave Unit C
- 15894 W 67th Place
- 15290 W 68th Place
- 6476 Orion Way
- 15902 W 64th Ave
- 15338 W 68th Ave
- 15336 W 68th Ave
- 15328 W 68th Ave
- 15336 68th Loop
- 15316 W 69th Dr
- 15312 W 69th Place
- 15345 W 69th Dr
- 15325 W 69th Dr
- 15313 W 69th Ave
- Urban Paired Plan at Geos - Paired Homes
- Reihenhaus Plan at Geos - Townhomes
- 15406 W 66th Dr Unit A
- 15406 W 66th Dr Unit C
- 15406 W 66th Dr Unit D
- 15406 W 66th Dr Unit E
- 15406 W 66th Dr Unit F
- 15406 W 66th Dr
- 15406 W 66th Dr Unit 15C
- 15406 W 66th Dr Unit 15D
- 15386 W 66th Dr Unit D
- 15386 W 66th Dr Unit B
- 15386 W 66th Dr Unit A
- 15386 W 66th Dr Unit F
- 15386 W 66th Dr Unit E
- 15386 W 66th Dr Unit C
- 15397 W 66th Dr Unit C
- 15397 W 66th Dr Unit B
- 15397 W 66th Dr Unit A
- 15427 W 66th Dr Unit C
- 15427 W 66th Dr Unit B
- 15427 W 66th Dr Unit A