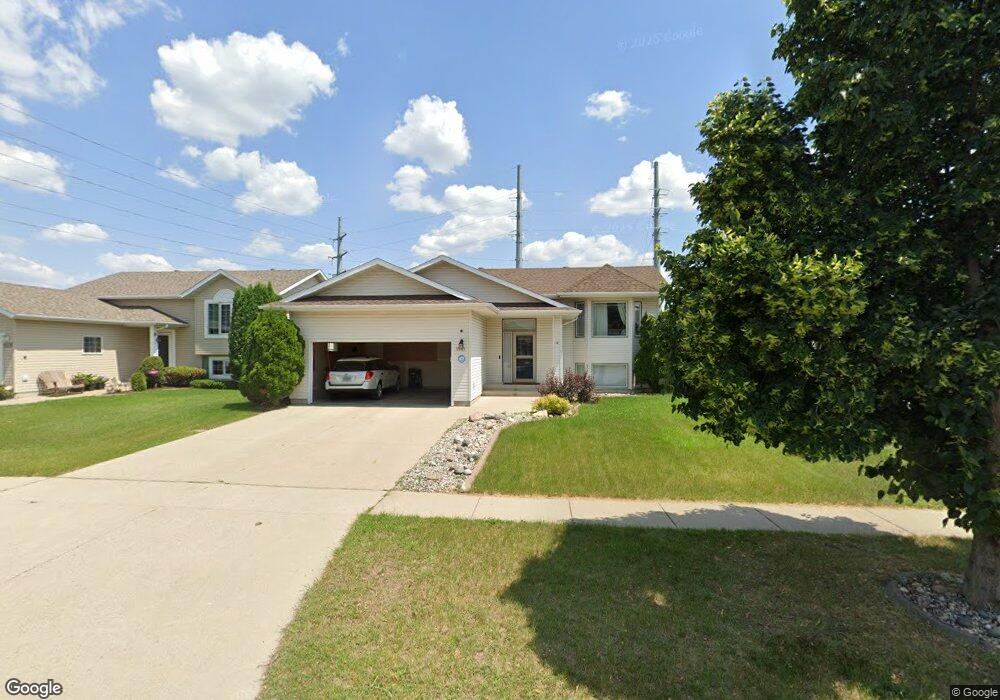
1541 8th St E West Fargo, ND 58078
Charleswood NeighborhoodEstimated Value: $356,000 - $370,769
4
Beds
3
Baths
2,046
Sq Ft
$178/Sq Ft
Est. Value
About This Home
This home is located at 1541 8th St E, West Fargo, ND 58078 and is currently estimated at $363,385, approximately $177 per square foot. 1541 8th St E is a home located in Cass County with nearby schools including South Elementary School, Cheney Middle School, and West Fargo High School.
Ownership History
Date
Name
Owned For
Owner Type
Purchase Details
Closed on
Dec 15, 2021
Sold by
Rodriguez Jose A and Rodriguez Kayla J
Bought by
Isse Ifrah M
Current Estimated Value
Home Financials for this Owner
Home Financials are based on the most recent Mortgage that was taken out on this home.
Original Mortgage
$284,905
Outstanding Balance
$259,797
Interest Rate
3.09%
Mortgage Type
New Conventional
Estimated Equity
$103,588
Purchase Details
Closed on
Apr 26, 2021
Sold by
Smith Gregory F and Smith Tavia K
Bought by
Rodriguez Jose A and Rodriguez Kayla J
Home Financials for this Owner
Home Financials are based on the most recent Mortgage that was taken out on this home.
Original Mortgage
$254,505
Interest Rate
3.05%
Mortgage Type
New Conventional
Create a Home Valuation Report for This Property
The Home Valuation Report is an in-depth analysis detailing your home's value as well as a comparison with similar homes in the area
Home Values in the Area
Average Home Value in this Area
Purchase History
| Date | Buyer | Sale Price | Title Company |
|---|---|---|---|
| Isse Ifrah M | $299,900 | New Title Company Name | |
| Rodriguez Jose A | $267,900 | The Title Co |
Source: Public Records
Mortgage History
| Date | Status | Borrower | Loan Amount |
|---|---|---|---|
| Open | Isse Ifrah M | $284,905 | |
| Previous Owner | Rodriguez Jose A | $254,505 |
Source: Public Records
Tax History
| Year | Tax Paid | Tax Assessment Tax Assessment Total Assessment is a certain percentage of the fair market value that is determined by local assessors to be the total taxable value of land and additions on the property. | Land | Improvement |
|---|---|---|---|---|
| 2024 | $4,228 | $147,550 | $26,500 | $121,050 |
| 2023 | $4,014 | $138,900 | $26,500 | $112,400 |
| 2022 | $4,035 | $134,800 | $26,500 | $108,300 |
| 2021 | $3,586 | $114,450 | $21,850 | $92,600 |
| 2020 | $3,443 | $112,050 | $21,850 | $90,200 |
| 2019 | $3,214 | $110,100 | $21,850 | $88,250 |
| 2018 | $3,069 | $108,300 | $21,850 | $86,450 |
| 2017 | $3,012 | $108,300 | $21,850 | $86,450 |
| 2016 | $2,700 | $105,800 | $21,850 | $83,950 |
| 2015 | $2,855 | $102,650 | $15,950 | $86,700 |
| 2014 | $2,673 | $95,950 | $15,950 | $80,000 |
| 2013 | $3,047 | $92,150 | $15,950 | $76,200 |
Source: Public Records
Map
Nearby Homes
- 790 Lakeridge Dr
- 783 14 1 2 Ave E
- 868 Lakeridge Place
- 714 14th Ave E
- 706 14th Ave E
- 715 Northridge Way
- 1424 14th St E Unit 11
- 1811 7th St E
- 1829 13th St E
- 1827 7th St E
- 602 12 1 2 Ave E Unit 5
- 1884 Huntington Ln
- 332 13th Ave E
- 1929 Pentland St
- 622 12th Ave E
- 245 12th Ave E
- 801 9th St E
- 1842 52nd St S
- 1814 Brentwood Ct
- 631 7th Ave E
Your Personal Tour Guide
Ask me questions while you tour the home.