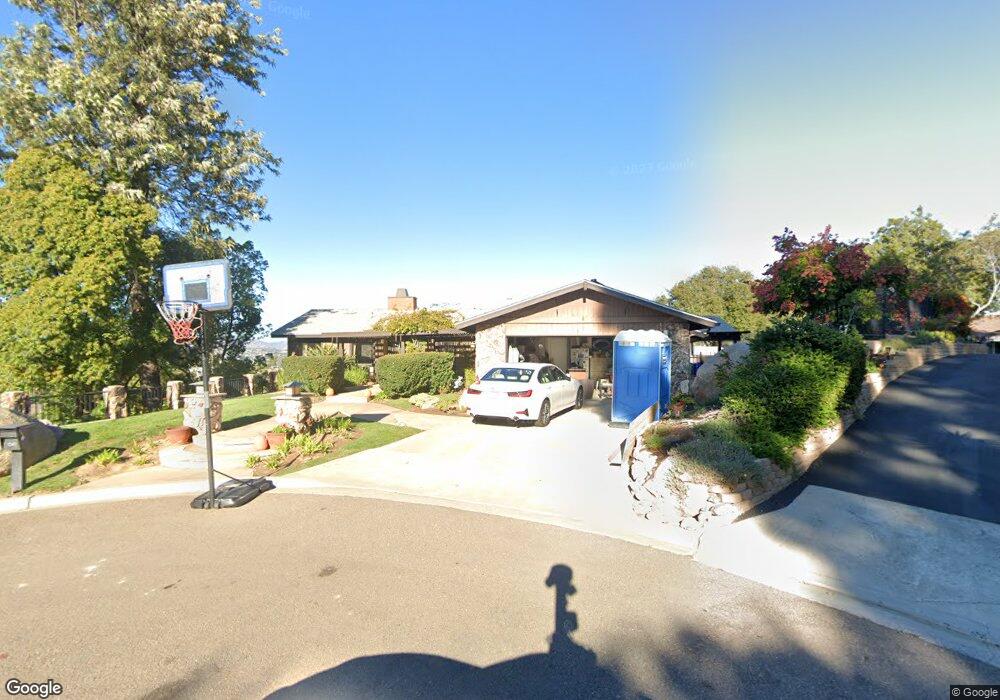
1541 Shadow Knolls Ct El Cajon, CA 92020
Rancho Park NeighborhoodEstimated Value: $1,424,453 - $1,489,000
4
Beds
4
Baths
2,900
Sq Ft
$503/Sq Ft
Est. Value
About This Home
This home is located at 1541 Shadow Knolls Ct, El Cajon, CA 92020 and is currently estimated at $1,458,363, approximately $502 per square foot. 1541 Shadow Knolls Ct is a home located in San Diego County with nearby schools including Fuerte Elementary School, Hillsdale Middle School, and Valhalla High.
Ownership History
Date
Name
Owned For
Owner Type
Purchase Details
Closed on
Jul 12, 2018
Sold by
Simonet Christopher and Simonet Christine
Bought by
Simonet Christopher T and Simonet Christine W
Current Estimated Value
Purchase Details
Closed on
Dec 20, 2014
Sold by
Phillips John N and Day Phillips Patricia Ann
Bought by
Simonet Christopher and Simonet Christine
Home Financials for this Owner
Home Financials are based on the most recent Mortgage that was taken out on this home.
Original Mortgage
$581,000
Outstanding Balance
$446,352
Interest Rate
4%
Mortgage Type
New Conventional
Estimated Equity
$1,012,011
Purchase Details
Closed on
Sep 25, 2009
Sold by
Phillips John W and Day Phillips Patricia Ann
Bought by
Phillips John W and Day Phillips Patricia Ann
Purchase Details
Closed on
May 29, 2001
Sold by
Short Donald R and Short Diane Rita
Bought by
Phillips John W and Day Phillips Patricia A
Home Financials for this Owner
Home Financials are based on the most recent Mortgage that was taken out on this home.
Original Mortgage
$340,000
Interest Rate
7.26%
Purchase Details
Closed on
May 9, 1997
Sold by
Short Donald R and Short Diane R
Bought by
Short Donald R and Short Diane Rita
Create a Home Valuation Report for This Property
The Home Valuation Report is an in-depth analysis detailing your home's value as well as a comparison with similar homes in the area
Home Values in the Area
Average Home Value in this Area
Purchase History
| Date | Buyer | Sale Price | Title Company |
|---|---|---|---|
| Simonet Christopher T | -- | None Available | |
| Simonet Christopher | $727,000 | Ticor Title Company | |
| Phillips John W | -- | None Available | |
| Phillips John W | $522,000 | California Title Company | |
| Short Donald R | -- | -- | |
| Short Donald R | -- | -- |
Source: Public Records
Mortgage History
| Date | Status | Borrower | Loan Amount |
|---|---|---|---|
| Open | Simonet Christopher | $581,000 | |
| Previous Owner | Phillips John W | $340,000 |
Source: Public Records
Tax History Compared to Growth
Tax History
| Year | Tax Paid | Tax Assessment Tax Assessment Total Assessment is a certain percentage of the fair market value that is determined by local assessors to be the total taxable value of land and additions on the property. | Land | Improvement |
|---|---|---|---|---|
| 2025 | $10,446 | $889,342 | $418,456 | $470,886 |
| 2024 | $10,446 | $871,904 | $410,251 | $461,653 |
| 2023 | $10,174 | $854,808 | $402,207 | $452,601 |
| 2022 | $9,838 | $823,342 | $394,321 | $429,021 |
| 2021 | $9,706 | $807,199 | $386,590 | $420,609 |
| 2020 | $9,603 | $798,923 | $382,626 | $416,297 |
| 2019 | $9,484 | $783,259 | $375,124 | $408,135 |
| 2018 | $9,330 | $767,902 | $367,769 | $400,133 |
| 2017 | $9,209 | $752,846 | $360,558 | $392,288 |
| 2016 | $8,842 | $738,086 | $353,489 | $384,597 |
| 2015 | $8,874 | $727,000 | $348,180 | $378,820 |
| 2014 | $7,599 | $629,062 | $301,275 | $327,787 |
Source: Public Records
Map
Nearby Homes
- 12218 Fuerte Dr
- 0 Hillsdale Rd Unit PTP2503874
- 1682 Grove Rd
- 1780 Grove Rd
- 1810 Jalisco Rd
- 1904 Grove Rd
- 11724 Shadow Valley Rd
- 1803 Hillsdale Ln
- 1542 Woody Hills Dr
- 11656 Altoona Dr
- 1173 San Lori Ln
- 1810 Hillsdale Rd Unit 18
- 1810 Hillsdale Rd Unit 57
- 12034 Calle de Montana Unit 286
- 1239 Avocado Summit Dr
- 12093 Calle de Medio Unit 131
- 11228 Horizon Hills Dr
- 12020 Calle de Medio Unit 174
- 12045 Calle de Medio Unit 104
- 1726 Valkyria Ln
- 1543 Shadow Knolls Ct
- 1539 Shadow Knolls Dr
- 1535 Shadow Knolls Dr
- 1531 Shadow Knolls Dr
- 1527 Shadow Knolls Dr
- 1547 Shadow Knolls Dr
- 1545 Shadow Knolls Ct
- 1887 E Chase Ave
- 1548 Jamacha Rd
- 1521 Shadow Knolls Ln
- 1544 Shadow Knolls Dr
- 1538 Shadow Knolls Dr
- 1889 E Chase Ave
- 1573 Shadow Knolls Dr
- 1559 Shadow Knolls Dr
- 1548 Shadow Knolls Dr
- 1517 Shadow Knolls Ln
- 1513 Shadow Knolls Ln
- 1524 Shadow Knolls Dr
- 1891 E Chase Ave