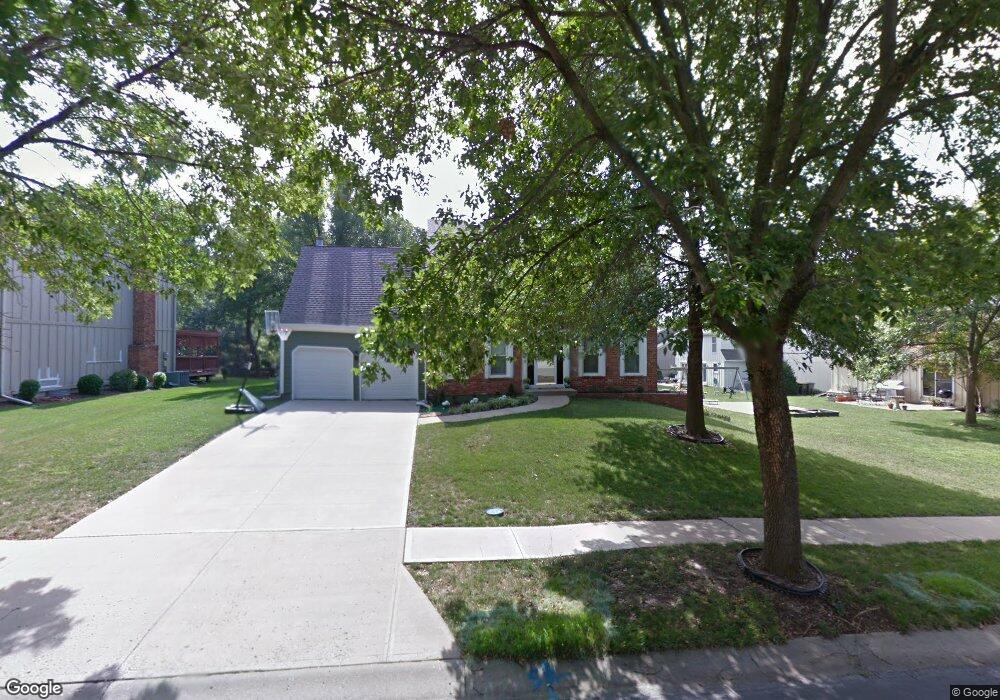
15413 W 92nd Place Lenexa, KS 66219
Estimated Value: $418,000 - $474,000
4
Beds
3
Baths
2,366
Sq Ft
$190/Sq Ft
Est. Value
About This Home
This home is located at 15413 W 92nd Place, Lenexa, KS 66219 and is currently estimated at $450,170, approximately $190 per square foot. 15413 W 92nd Place is a home located in Johnson County with nearby schools including Sunflower Elementary School, Westridge Middle School, and Shawnee Mission West High School.
Ownership History
Date
Name
Owned For
Owner Type
Purchase Details
Closed on
Oct 25, 2018
Sold by
Wagenheim Marc H and Wagenheim Deborah M
Bought by
Wagenheim Marc H
Current Estimated Value
Home Financials for this Owner
Home Financials are based on the most recent Mortgage that was taken out on this home.
Original Mortgage
$250,813
Outstanding Balance
$218,273
Interest Rate
4.5%
Mortgage Type
FHA
Estimated Equity
$231,897
Purchase Details
Closed on
Apr 22, 2009
Sold by
Brack Daniel H and Brack Karen L
Bought by
Wagenheim Marc H and Wagenheim Deborah M
Home Financials for this Owner
Home Financials are based on the most recent Mortgage that was taken out on this home.
Original Mortgage
$219,819
Interest Rate
4.84%
Mortgage Type
FHA
Purchase Details
Closed on
Apr 24, 2002
Sold by
Rosberg Kenneth W and Rosberg Janet G
Bought by
Brack Daniel H and Brack Karen L
Home Financials for this Owner
Home Financials are based on the most recent Mortgage that was taken out on this home.
Original Mortgage
$197,000
Interest Rate
7.09%
Mortgage Type
Stand Alone First
Create a Home Valuation Report for This Property
The Home Valuation Report is an in-depth analysis detailing your home's value as well as a comparison with similar homes in the area
Home Values in the Area
Average Home Value in this Area
Purchase History
| Date | Buyer | Sale Price | Title Company |
|---|---|---|---|
| Wagenheim Marc H | -- | Boston National Title Agency | |
| Wagenheim Marc H | -- | First American Title Ins Co | |
| Brack Daniel H | -- | Security Land Title Company |
Source: Public Records
Mortgage History
| Date | Status | Borrower | Loan Amount |
|---|---|---|---|
| Open | Wagenheim Marc H | $250,813 | |
| Closed | Wagenheim Marc H | $219,819 | |
| Previous Owner | Brack Daniel H | $197,000 | |
| Closed | Brack Daniel H | $157,600 |
Source: Public Records
Tax History Compared to Growth
Tax History
| Year | Tax Paid | Tax Assessment Tax Assessment Total Assessment is a certain percentage of the fair market value that is determined by local assessors to be the total taxable value of land and additions on the property. | Land | Improvement |
|---|---|---|---|---|
| 2024 | $4,914 | $44,424 | $8,090 | $36,334 |
| 2023 | $4,971 | $44,160 | $7,708 | $36,452 |
| 2022 | $4,307 | $38,226 | $7,338 | $30,888 |
| 2021 | $4,307 | $35,075 | $6,990 | $28,085 |
| 2020 | $3,924 | $32,694 | $6,985 | $25,709 |
| 2019 | $3,783 | $31,499 | $6,079 | $25,420 |
| 2018 | $3,994 | $33,005 | $5,527 | $27,478 |
| 2017 | $3,889 | $31,142 | $5,027 | $26,115 |
| 2016 | $3,687 | $29,141 | $5,027 | $24,114 |
| 2015 | $3,535 | $28,129 | $5,027 | $23,102 |
| 2013 | -- | $25,783 | $5,027 | $20,756 |
Source: Public Records
Map
Nearby Homes
- 15320 W 92nd Place
- 9124 Constance St
- 9207 Boehm Dr
- 9203 Boehm Dr
- 9131 Darnell St
- 15920 W 91st Terrace
- 8946 Country Hill Ct
- 9318 Greenway Ln
- 9202 Greenway Ln
- 8919 Greenway Ln
- 9029 Acuff Ln
- 15611 W 86th St
- 8616 Baska Ct
- 14101 W 88th Place
- 8641 Greenwood Ln
- 15710 W 84th Terrace
- 8403 Swarner Dr
- 14424 W 84th Terrace
- 15529 W 83rd Terrace
- 14915 W 84th Terrace
- 15405 W 92nd Place
- 9243 Twilight Ln
- 9239 Twilight Ln
- 9247 Twilight Ln
- 15319 W 92nd Place
- 9251 Twilight Ln
- 9244 Woodstone St
- 15410 W 92nd Place
- 15416 W 92nd Place
- 9238 Woodstone St
- 9232 Woodstone St
- 15404 W 92nd Place
- 9248 Woodstone St
- 15422 W 92nd Place
- 9226 Woodstone St
- 15326 W 92nd Place
- 9242 Twilight Ln
- 9238 Twilight Ln
- 9255 Twilight Ln
- 15428 W 92nd Place