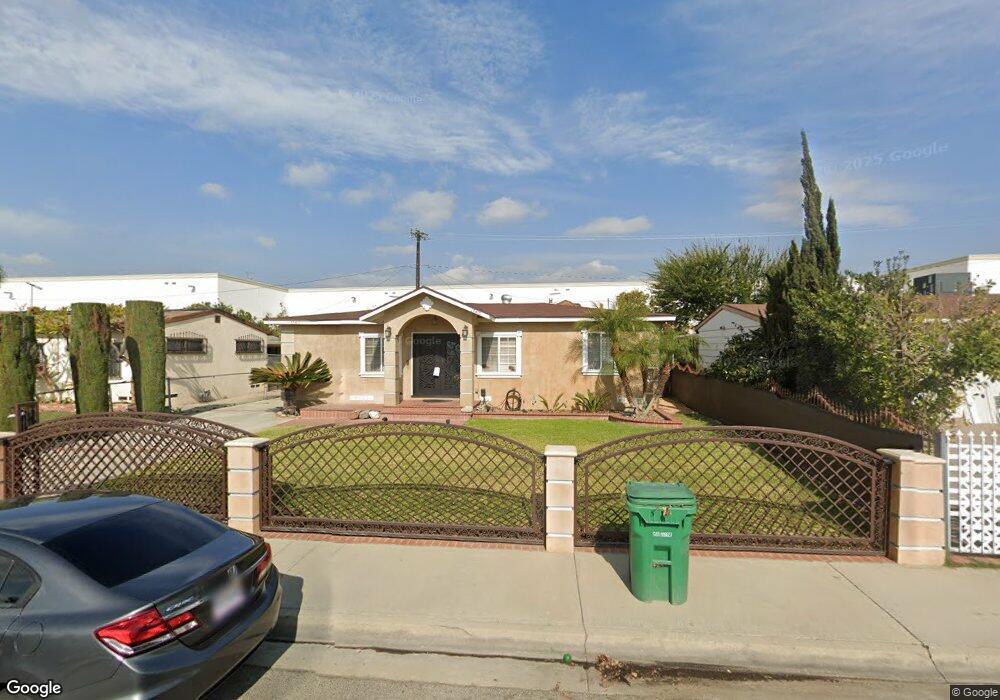
15415 Sandstone St Baldwin Park, CA 91706
Estimated Value: $660,000 - $839,000
5
Beds
4
Baths
2,019
Sq Ft
$367/Sq Ft
Est. Value
About This Home
This home is located at 15415 Sandstone St, Baldwin Park, CA 91706 and is currently estimated at $741,667, approximately $367 per square foot. 15415 Sandstone St is a home located in Los Angeles County with nearby schools including Pleasant View Elementary and Baldwin Park High School.
Ownership History
Date
Name
Owned For
Owner Type
Purchase Details
Closed on
Nov 10, 2025
Sold by
Sanchez Jose O and Duran Jose Omar
Bought by
Sanchez Family Trust and Duran
Current Estimated Value
Purchase Details
Closed on
Oct 29, 1999
Sold by
Sanchez Jose O
Bought by
Sanchez Jose O and Tavares Ana M
Purchase Details
Closed on
Jul 21, 1999
Sold by
Hud
Bought by
Sanchez Jose O and Tavares Ana M
Home Financials for this Owner
Home Financials are based on the most recent Mortgage that was taken out on this home.
Original Mortgage
$105,320
Interest Rate
7.56%
Mortgage Type
FHA
Purchase Details
Closed on
Jan 25, 1999
Sold by
Norwest Mtg Inc
Bought by
Hud
Purchase Details
Closed on
Sep 18, 1998
Sold by
Sandoval Luis R
Bought by
Norwest Mtg Inc
Purchase Details
Closed on
Jul 24, 1992
Sold by
Hernandez Margarito
Bought by
Sandoval Luis Roberto and Alarcon Norma A
Home Financials for this Owner
Home Financials are based on the most recent Mortgage that was taken out on this home.
Original Mortgage
$113,609
Interest Rate
7.15%
Mortgage Type
FHA
Create a Home Valuation Report for This Property
The Home Valuation Report is an in-depth analysis detailing your home's value as well as a comparison with similar homes in the area
Home Values in the Area
Average Home Value in this Area
Purchase History
| Date | Buyer | Sale Price | Title Company |
|---|---|---|---|
| Sanchez Family Trust | -- | None Listed On Document | |
| Sanchez Jose O | -- | -- | |
| Sanchez Jose O | $106,000 | Provident Title Company | |
| Hud | -- | Fidelity National Title Ins | |
| Norwest Mtg Inc | $120,725 | Fidelity National Title Ins | |
| Sandoval Luis Roberto | -- | Orange Coast Title |
Source: Public Records
Mortgage History
| Date | Status | Borrower | Loan Amount |
|---|---|---|---|
| Previous Owner | Sanchez Jose O | $105,320 | |
| Previous Owner | Sandoval Luis Roberto | $113,609 |
Source: Public Records
Tax History
| Year | Tax Paid | Tax Assessment Tax Assessment Total Assessment is a certain percentage of the fair market value that is determined by local assessors to be the total taxable value of land and additions on the property. | Land | Improvement |
|---|---|---|---|---|
| 2025 | $10,524 | $327,926 | $113,570 | $214,356 |
| 2024 | $10,524 | $321,497 | $111,344 | $210,153 |
| 2023 | $9,570 | $240,194 | $109,161 | $131,033 |
| 2022 | $3,436 | $235,485 | $107,021 | $128,464 |
| 2021 | $3,378 | $230,869 | $104,923 | $125,946 |
| 2019 | $3,181 | $224,023 | $101,812 | $122,211 |
| 2018 | $2,980 | $219,631 | $99,816 | $119,815 |
| 2016 | $2,795 | $211,104 | $95,941 | $115,163 |
| 2015 | $2,864 | $207,934 | $94,500 | $113,434 |
| 2014 | $2,827 | $203,861 | $92,649 | $111,212 |
Source: Public Records
Map
Nearby Homes
- 5045 La Sena Ave
- 4856 Stancroft Ave
- 14609 Cavette Place
- 4816 Elizabeth St
- 14457 Cavette Place
- 2131 W San Bernardino Rd Unit 46
- 2131 W San Bernardino Rd Unit 35
- 1823 W Palm Dr
- 4668 Maine Ave
- 14334 Gates St
- 15228 Ramona Blvd
- 1191 E Laxford Rd
- 4810 N Vincent Ave
- 4850 N Vincent Ave
- 1811 David Ct
- 1081 W Arrow Hwy Unit 96
- 1081 W Arrow Hwy Unit 46
- 4524 Landis Ave
- 14506 Clark St Unit 6
- 14053 Olive St
- 15415 Sandstone St Unit A
- 15421 Sandstone St
- 15409 Sandstone St
- 15425 Sandstone St
- 15403 Sandstone St
- 15414 Sandstone St
- 15431 Sandstone St
- 15408 Sandstone St
- 15418 Sandstone St
- 15402 Sandstone St
- 15437 Sandstone St
- 15430 Sandstone St
- 5063 La Sena Ave
- 5057 La Sena Ave
- 5034 La Sena Ave
- 15419 Devannah St
- 15413 Devannah St
- 5051 La Sena Ave
- 15443 Sandstone St
- 15440 Sandstone St
Your Personal Tour Guide
Ask me questions while you tour the home.