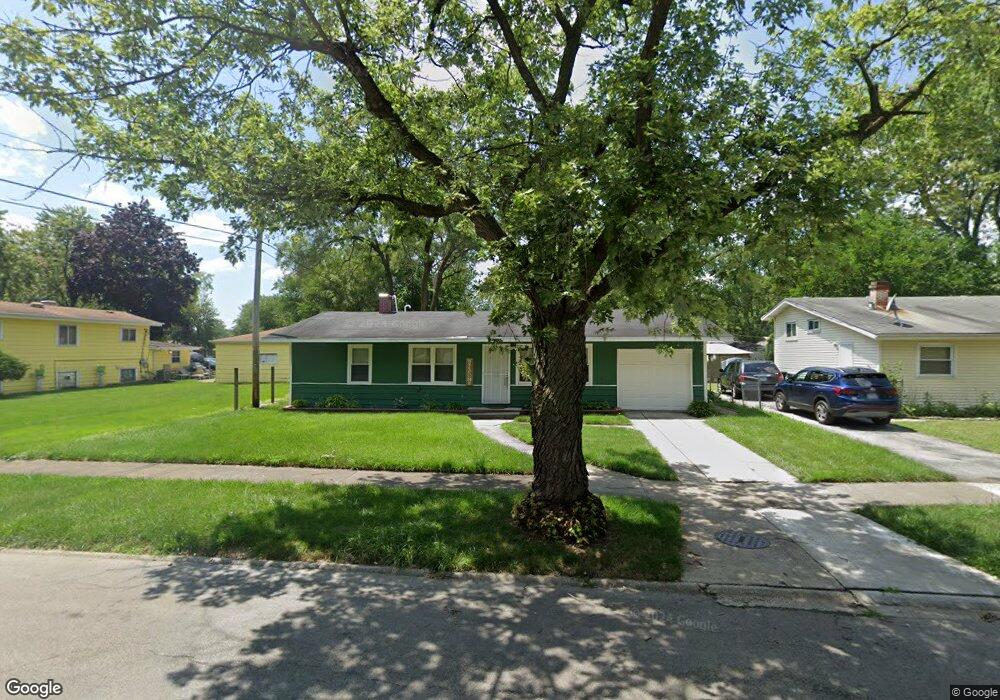
15426 Maple Ln Markham, IL 60428
Country Aire NeighborhoodEstimated Value: $136,000 - $171,000
3
Beds
1
Bath
1,200
Sq Ft
$126/Sq Ft
Est. Value
About This Home
This home is located at 15426 Maple Ln, Markham, IL 60428 and is currently estimated at $151,510, approximately $126 per square foot. 15426 Maple Ln is a home located in Cook County with nearby schools including Central Park Elementary School, Bremen High School, and Academic Mastery Academy.
Ownership History
Date
Name
Owned For
Owner Type
Purchase Details
Closed on
Jan 10, 2018
Sold by
Gosa Dwayne
Bought by
Zayas Jessica
Current Estimated Value
Purchase Details
Closed on
Jul 26, 2016
Sold by
Csl Properties Llc
Bought by
Gosa Dwayne
Purchase Details
Closed on
Feb 28, 2008
Sold by
Us Bank Na
Bought by
Csl Properties Llc
Home Financials for this Owner
Home Financials are based on the most recent Mortgage that was taken out on this home.
Original Mortgage
$33,600
Interest Rate
5.74%
Mortgage Type
Commercial
Purchase Details
Closed on
May 9, 2007
Sold by
Flemons Atiba
Bought by
Wachovia Bank Na and Asset Backed Pass Through Certificates S
Purchase Details
Closed on
Sep 16, 2004
Sold by
Burts Lois
Bought by
Flemons Atiba
Home Financials for this Owner
Home Financials are based on the most recent Mortgage that was taken out on this home.
Original Mortgage
$71,250
Interest Rate
5.89%
Mortgage Type
Unknown
Create a Home Valuation Report for This Property
The Home Valuation Report is an in-depth analysis detailing your home's value as well as a comparison with similar homes in the area
Home Values in the Area
Average Home Value in this Area
Purchase History
| Date | Buyer | Sale Price | Title Company |
|---|---|---|---|
| Zayas Jessica | $25,500 | Old Republic Title | |
| Gosa Dwayne | -- | Attorney | |
| Csl Properties Llc | $42,000 | First American Title | |
| Us Bank Na | -- | First American Title Ins Co | |
| Wachovia Bank Na | -- | None Available | |
| Flemons Atiba | $75,000 | First American Title Ins Co |
Source: Public Records
Mortgage History
| Date | Status | Borrower | Loan Amount |
|---|---|---|---|
| Previous Owner | Csl Properties Llc | $33,600 | |
| Previous Owner | Flemons Atiba | $71,250 |
Source: Public Records
Tax History
| Year | Tax Paid | Tax Assessment Tax Assessment Total Assessment is a certain percentage of the fair market value that is determined by local assessors to be the total taxable value of land and additions on the property. | Land | Improvement |
|---|---|---|---|---|
| 2025 | $3,568 | $10,001 | $1,688 | $8,313 |
| 2024 | $3,568 | $10,001 | $1,688 | $8,313 |
| 2023 | $884 | $10,001 | $1,688 | $8,313 |
| 2022 | $884 | $4,626 | $1,500 | $3,126 |
| 2021 | $918 | $4,626 | $1,500 | $3,126 |
| 2020 | $1,038 | $4,626 | $1,500 | $3,126 |
| 2019 | $3,692 | $5,625 | $1,312 | $4,313 |
| 2018 | $3,577 | $5,625 | $1,312 | $4,313 |
| 2017 | $3,476 | $5,625 | $1,312 | $4,313 |
| 2016 | $2,890 | $4,610 | $1,125 | $3,485 |
| 2015 | $2,693 | $4,610 | $1,125 | $3,485 |
| 2014 | $2,692 | $4,610 | $1,125 | $3,485 |
| 2013 | $2,689 | $4,962 | $1,125 | $3,837 |
Source: Public Records
Map
Nearby Homes
- 15333 Cherry Ln
- 15319 Cherry Ln
- 15330 Cherry Ln
- 3314 Willow Ln
- 3330 Roesner Dr
- 3451 W 155th St
- 15516 Frontage Rd
- 15435 Hamlin Ave
- 15531 Millard Ave
- 15503 Homan Ave
- 15511 Homan Ave
- 15515 Homan Ave
- 15525 Homan Ave
- 3851 153rd Place
- 15514 Ridgeway Ave
- 15112 Ridgeway Ave
- 15622 Millard Ave
- 3900 W 155th St
- 15634 Ridgeway Ave
- 15031 Hamlin Ave
- 15422 Maple Ln
- 3460 Magnolia Dr
- 3500 Magnolia Dr
- 15425 Cherry Ln
- 15418 Maple Ln
- 15421 Cherry Ln
- 3508 Magnolia Dr
- 15423 Maple Ln
- 15431 Maple Ln
- 15417 Maple Ln
- 15417 Maple Ln
- 15417 Maple Ln
- 15414 Maple Ln
- 15413 Cherry Ln
- 3438 Magnolia Dr
- 15405 Maple Ln
- 3457 Magnolia Dr
- 3463 Magnolia Dr
- 15407 Cherry Ln
- 3451 Magnolia Dr
Your Personal Tour Guide
Ask me questions while you tour the home.