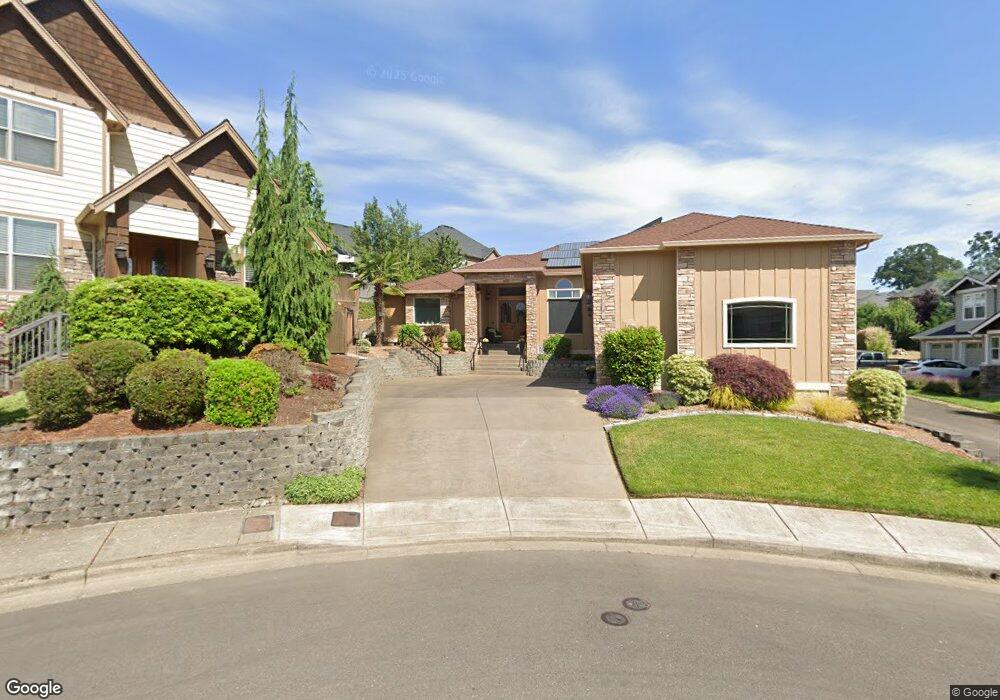
1543 Broken Wheel Ct NW Salem, OR 97304
West Salem NeighborhoodEstimated Value: $668,754 - $735,000
3
Beds
2
Baths
2,840
Sq Ft
$245/Sq Ft
Est. Value
About This Home
This home is located at 1543 Broken Wheel Ct NW, Salem, OR 97304 and is currently estimated at $694,939, approximately $244 per square foot. 1543 Broken Wheel Ct NW is a home located in Polk County with nearby schools including Kalapuya Elementary School, Straub Middle School, and West Salem High School.
Ownership History
Date
Name
Owned For
Owner Type
Purchase Details
Closed on
Sep 14, 2024
Sold by
Loberg Lance G and Loberg Gabriela
Bought by
Loberg Lance Gregory and Revocabl Gabriela
Current Estimated Value
Purchase Details
Closed on
Jun 21, 2013
Sold by
Loberg Lance G
Bought by
Loberg Gabriela
Purchase Details
Closed on
Sep 18, 2009
Sold by
Federal Deposit Insurance Corporation
Bought by
Loberg Lance G
Home Financials for this Owner
Home Financials are based on the most recent Mortgage that was taken out on this home.
Original Mortgage
$284,747
Interest Rate
5.18%
Mortgage Type
FHA
Purchase Details
Closed on
Jan 21, 2009
Sold by
Stroie Viorica
Bought by
Silver Falls Bank
Purchase Details
Closed on
Feb 16, 2007
Sold by
G Ace Construction Inc
Bought by
Stroie Viorica C
Home Financials for this Owner
Home Financials are based on the most recent Mortgage that was taken out on this home.
Original Mortgage
$400,000
Interest Rate
6.21%
Mortgage Type
Construction
Create a Home Valuation Report for This Property
The Home Valuation Report is an in-depth analysis detailing your home's value as well as a comparison with similar homes in the area
Home Values in the Area
Average Home Value in this Area
Purchase History
| Date | Buyer | Sale Price | Title Company |
|---|---|---|---|
| Loberg Lance Gregory | -- | None Listed On Document | |
| Loberg Gabriela | -- | None Available | |
| Loberg Lance G | $290,000 | First American Title | |
| Silver Falls Bank | -- | Lawyers Title Ins Corp | |
| Stroie Viorica C | $135,000 | Lawyers Title Ins Corp | |
| G Ace Construction Inc | $130,000 | Lawyers Title Ins Corp |
Source: Public Records
Mortgage History
| Date | Status | Borrower | Loan Amount |
|---|---|---|---|
| Previous Owner | Loberg Lance G | $284,747 | |
| Previous Owner | Stroie Viorica C | $400,000 |
Source: Public Records
Tax History Compared to Growth
Tax History
| Year | Tax Paid | Tax Assessment Tax Assessment Total Assessment is a certain percentage of the fair market value that is determined by local assessors to be the total taxable value of land and additions on the property. | Land | Improvement |
|---|---|---|---|---|
| 2025 | $7,789 | $425,680 | $97,870 | $327,810 |
| 2024 | $7,789 | $413,290 | $95,020 | $318,270 |
| 2023 | $7,563 | $401,260 | $92,250 | $309,010 |
| 2022 | $7,320 | $389,580 | $89,560 | $300,020 |
| 2021 | $7,112 | $378,240 | $86,960 | $291,280 |
| 2020 | $6,901 | $367,230 | $84,430 | $282,800 |
| 2019 | $6,660 | $356,540 | $81,970 | $274,570 |
| 2018 | $6,549 | $346,160 | $79,590 | $266,570 |
| 2017 | $5,902 | $336,080 | $77,270 | $258,810 |
| 2016 | $5,761 | $326,300 | $75,020 | $251,280 |
| 2015 | $5,810 | $316,800 | $72,830 | $243,970 |
| 2014 | $5,552 | $307,580 | $70,710 | $236,870 |
Source: Public Records
Map
Nearby Homes
- 1598 Bartlett Hill Dr NW
- 1559 Bartlett Hill Dr NW
- 2757 Islander Ave NW
- 2716 Old Farm Ave NW
- 1410 W Meadows Dr NW
- 2869 Mayfly Ave NW
- 1784 Settlers Spring Dr NW
- 1804 Settlers Spring Dr NW
- 1375 Titan Dr NW
- 0 Doaks Ferry Rd NW Unit 2300 354679673
- 1180 Mogul St NW
- 2865 Hoo Doo Ct NW
- 2850 Hoo Doo Ct NW
- 2587 Hoo Doo Dr NW
- 3175 Glen Creek Rd NW
- 3247 Champlain Dr NW
- 2351 Westfarthing Way NW
- 2650 Hoo Doo Dr NW
- 1369 34th Ave NW
- 1556 Broken Wheel Ct NW
- 1533 Broken Wheel Ct NW
- 1588 Bartlett Hill Dr NW
- 1546 Broken Wheel Ct NW
- 1568 Bartlett Hill Dr NW
- 1568 Bartlett Hill Dr NW
- 1612 Bartlett Hill Dr NW
- 1523 Broken Wheel Ct NW
- 1576 Broken Wheel Ct NW
- 2870 Horse Clover Dr NW
- Lot 237 Bartlett Hill Dr NW
- Lot 239 Bartlett Hill Dr NW
- Lot 244 Bartlett Hill Dr NW
- Lot 247 Bartlett Hill Dr NW
- Lot 242 Bartlett Hill Dr NW
- Lot 245 Bartlett Hill Dr NW
- Lot 241 Bartlett Hill Dr NW
- Lot 243 Bartlett Hill Dr NW
- Lot 238 Bartlett Hill Dr NW
- Lot 240 Bartlett Hill Dr NW