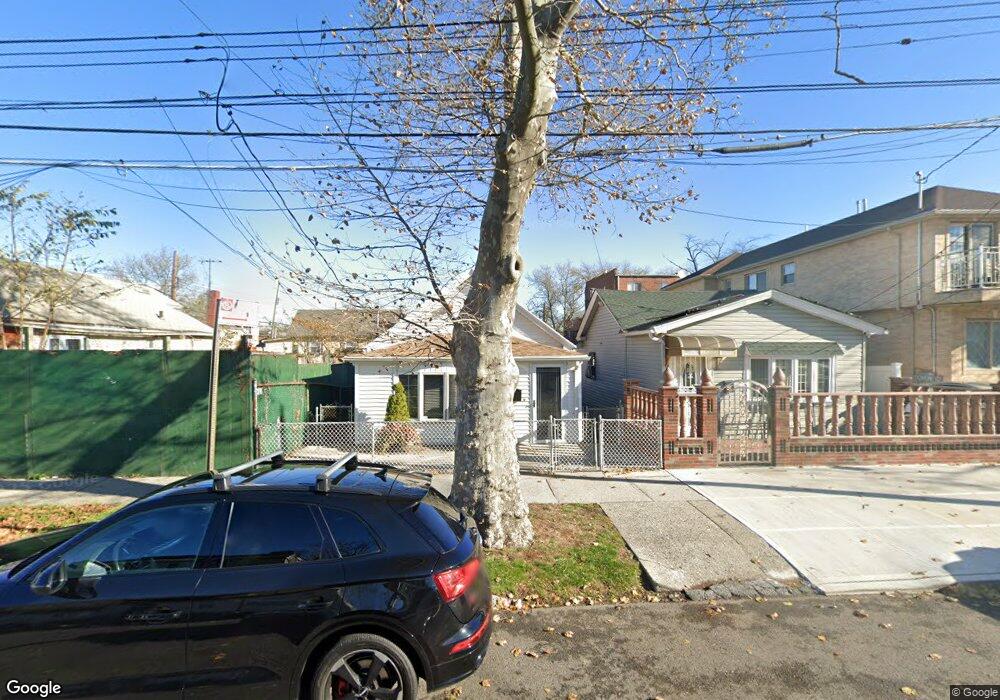
1543 E 98th St Brooklyn, NY 11236
Canarsie NeighborhoodEstimated Value: $584,300 - $812,000
3
Beds
1
Bath
900
Sq Ft
$786/Sq Ft
Est. Value
About This Home
This home is located at 1543 E 98th St, Brooklyn, NY 11236 and is currently estimated at $707,575, approximately $786 per square foot. 1543 E 98th St is a home located in Kings County with nearby schools including P.S. 272 Curtis Estabrook, I.S. 211 John Wilson, and Canarsie Ascend Charter School.
Ownership History
Date
Name
Owned For
Owner Type
Purchase Details
Closed on
Oct 10, 2003
Sold by
Andrew Kenneth and Andrews Jeanne
Bought by
Andrew Kenneth
Current Estimated Value
Home Financials for this Owner
Home Financials are based on the most recent Mortgage that was taken out on this home.
Original Mortgage
$51,809
Outstanding Balance
$23,155
Interest Rate
5.71%
Mortgage Type
Purchase Money Mortgage
Estimated Equity
$684,420
Purchase Details
Closed on
Nov 16, 1998
Sold by
Murello Dominick
Bought by
Andrews Kenneth and Andrews Jeanne
Home Financials for this Owner
Home Financials are based on the most recent Mortgage that was taken out on this home.
Original Mortgage
$135,200
Interest Rate
6.74%
Mortgage Type
FHA
Purchase Details
Closed on
Feb 2, 1995
Sold by
Murello Dominick
Bought by
Murello Dominick and Murello Lori
Create a Home Valuation Report for This Property
The Home Valuation Report is an in-depth analysis detailing your home's value as well as a comparison with similar homes in the area
Home Values in the Area
Average Home Value in this Area
Purchase History
| Date | Buyer | Sale Price | Title Company |
|---|---|---|---|
| Andrew Kenneth | -- | -- | |
| Andrew Kenneth | -- | -- | |
| Andrews Kenneth | $136,000 | First American Title Ins Co | |
| Andrews Kenneth | $136,000 | First American Title Ins Co | |
| Murello Dominick | -- | -- | |
| Murello Dominick | -- | -- |
Source: Public Records
Mortgage History
| Date | Status | Borrower | Loan Amount |
|---|---|---|---|
| Open | Andrew Kenneth | $51,809 | |
| Closed | Andrew Kenneth | $51,809 | |
| Previous Owner | Andrews Kenneth | $135,200 |
Source: Public Records
Tax History
| Year | Tax Paid | Tax Assessment Tax Assessment Total Assessment is a certain percentage of the fair market value that is determined by local assessors to be the total taxable value of land and additions on the property. | Land | Improvement |
|---|---|---|---|---|
| 2025 | $4,122 | $34,200 | $9,720 | $24,480 |
| 2024 | $4,122 | $40,260 | $9,720 | $30,540 |
| 2023 | $4,125 | $38,400 | $9,720 | $28,680 |
| 2022 | $3,804 | $38,520 | $9,720 | $28,800 |
| 2021 | $3,776 | $29,760 | $9,720 | $20,040 |
| 2020 | $1,876 | $30,300 | $9,720 | $20,580 |
| 2019 | $3,529 | $30,300 | $9,720 | $20,580 |
| 2018 | $3,391 | $18,093 | $6,303 | $11,790 |
| 2017 | $3,181 | $17,076 | $7,538 | $9,538 |
| 2016 | $2,913 | $16,123 | $6,465 | $9,658 |
| 2015 | $1,723 | $16,123 | $8,412 | $7,711 |
| 2014 | $1,723 | $15,225 | $7,943 | $7,282 |
Source: Public Records
Map
Nearby Homes
- 1410 E 100th St
- 9811 Seaview Ave
- 1361 E 99th St
- 1368 E 100th St
- 1983 Rockaway Pkwy
- 1355 E 99th St
- 1336 E 99th St
- 1377 E 101st St
- 1625 E 96th St
- 1467 E 101st St
- 1322 E 99th St
- 1618 E 96th St
- 1644 E 96th St
- 1450 E 98th St
- 1541 E 95th St
- 9623 Avenue M
- 9617 Avenue M
- 1418 E 104th St
- 1242 E 100th St
- 1498 E 95th St
- 1545 E 98th St
- 1537 E 98th St
- 1537 E 98th St
- 1537 E 98th St Unit LAND
- 1549 E 98th St
- 1549 E 98th St
- 1549-1553 E 98th St
- 9816 Avenue N
- 1553 E 98th St
- 1553 E 98 St
- 9818 Avenue N
- 1555 E 98th St
- 1416 E 99th St
- 1418 E 99th St
- 9820 Avenue N
- 1422 E 99th St
- 1535 E 98th St
- 1424 E 99th St
- 1546 E 98th St
- 1542 E 98th St
Your Personal Tour Guide
Ask me questions while you tour the home.