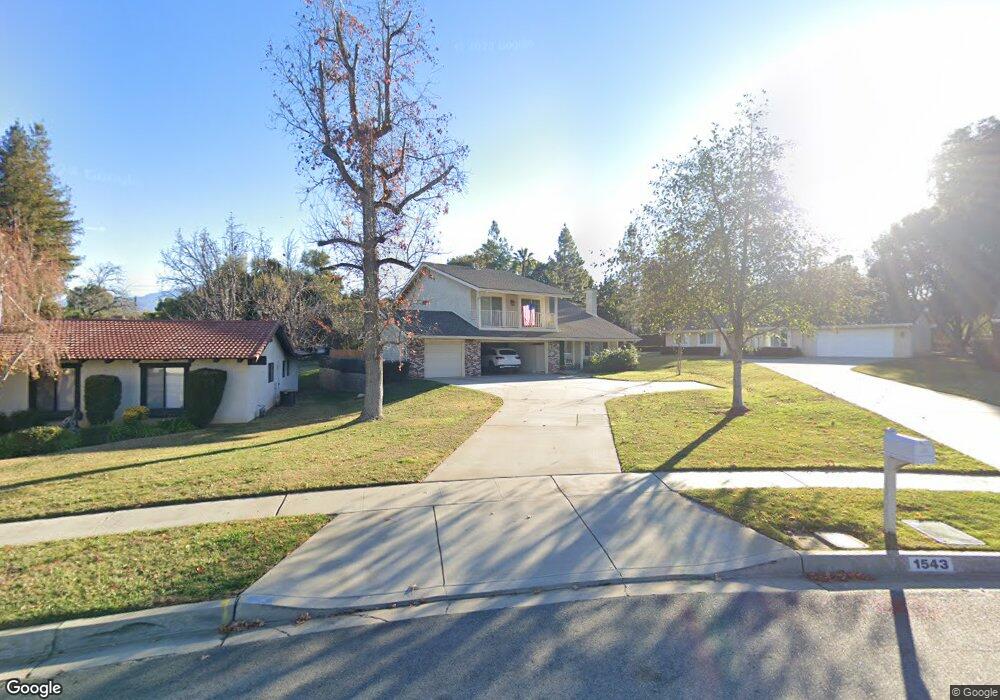
1543 Lynne Ct Redlands, CA 92373
South Redlands NeighborhoodEstimated Value: $711,078 - $841,000
4
Beds
3
Baths
2,233
Sq Ft
$340/Sq Ft
Est. Value
About This Home
This home is located at 1543 Lynne Ct, Redlands, CA 92373 and is currently estimated at $759,020, approximately $339 per square foot. 1543 Lynne Ct is a home located in San Bernardino County with nearby schools including Kimberly Elementary School, Moore Middle School, and Redlands Senior High School.
Ownership History
Date
Name
Owned For
Owner Type
Purchase Details
Closed on
Dec 22, 2002
Sold by
Cook Ronald W and Cook Lucille A
Bought by
Gilbert Christopher N and Gilbert Christine S
Current Estimated Value
Home Financials for this Owner
Home Financials are based on the most recent Mortgage that was taken out on this home.
Original Mortgage
$276,000
Outstanding Balance
$115,309
Interest Rate
5.86%
Estimated Equity
$643,711
Purchase Details
Closed on
Sep 22, 1998
Sold by
Va
Bought by
Ryder Scott M and Ryder Mary B
Home Financials for this Owner
Home Financials are based on the most recent Mortgage that was taken out on this home.
Original Mortgage
$127,500
Interest Rate
6.54%
Purchase Details
Closed on
Jul 24, 1998
Sold by
Ryder Scott M Dva and Ryder Mary B Dva
Bought by
Cook Ronald W and Cook Lucille A
Home Financials for this Owner
Home Financials are based on the most recent Mortgage that was taken out on this home.
Original Mortgage
$127,500
Interest Rate
6.54%
Create a Home Valuation Report for This Property
The Home Valuation Report is an in-depth analysis detailing your home's value as well as a comparison with similar homes in the area
Home Values in the Area
Average Home Value in this Area
Purchase History
| Date | Buyer | Sale Price | Title Company |
|---|---|---|---|
| Gilbert Christopher N | $345,000 | Fidelity National Title | |
| Ryder Scott M | -- | Chicago Title Co | |
| Cook Ronald W | $170,000 | Chicago Title Co |
Source: Public Records
Mortgage History
| Date | Status | Borrower | Loan Amount |
|---|---|---|---|
| Open | Gilbert Christopher N | $276,000 | |
| Previous Owner | Cook Ronald W | $127,500 |
Source: Public Records
Tax History Compared to Growth
Tax History
| Year | Tax Paid | Tax Assessment Tax Assessment Total Assessment is a certain percentage of the fair market value that is determined by local assessors to be the total taxable value of land and additions on the property. | Land | Improvement |
|---|---|---|---|---|
| 2025 | $5,800 | $499,677 | $65,174 | $434,503 |
| 2024 | $5,800 | $489,879 | $63,896 | $425,983 |
| 2023 | $5,794 | $480,273 | $62,643 | $417,630 |
| 2022 | $5,710 | $470,856 | $61,415 | $409,441 |
| 2021 | $5,814 | $461,624 | $60,211 | $401,413 |
| 2020 | $1,509 | $456,891 | $59,594 | $397,297 |
| 2019 | $5,567 | $447,932 | $58,425 | $389,507 |
| 2018 | $5,342 | $439,149 | $57,279 | $381,870 |
| 2017 | $5,295 | $430,538 | $56,156 | $374,382 |
| 2016 | $5,234 | $422,096 | $55,055 | $367,041 |
| 2015 | $5,194 | $415,756 | $54,228 | $361,528 |
| 2014 | $5,098 | $407,612 | $53,166 | $354,446 |
Source: Public Records
Map
Nearby Homes
- 1525 Lynne Ct
- 0 Garden St Unit EV23054640
- 1517 Pamela Crest
- 225 Sunset Dr
- 435 Marilyn Ln
- 446 E Sunset Dr N
- 419 Marcia St
- 1627 Halsey St
- 505 E Sunset Dr N
- 375 Franklin Ave
- 512 Golden Dr W
- 533 Via Vista Dr
- 1705 Rossmont Dr
- 1702 Dwight St
- 608 Via Vista Dr
- 0 Ford St
- 612 Golden Dr W
- 1515 Elizabeth St
- 1710 Fairmont Dr
- 613 E Sunset Dr N