

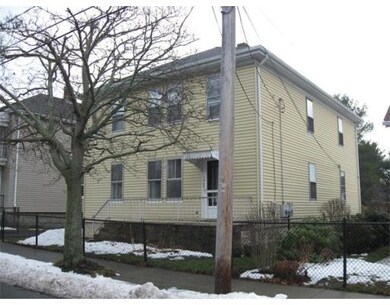
1543 Slade St Fall River, MA 02721
Maplewood Neighborhood
4
Beds
2
Baths
2,160
Sq Ft
5,663
Sq Ft Lot
About This Home
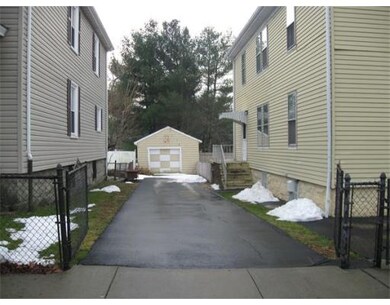
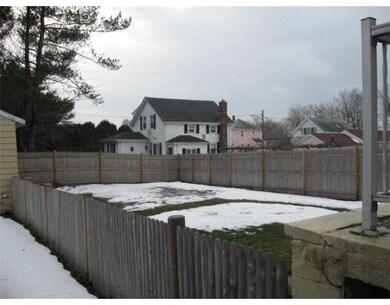
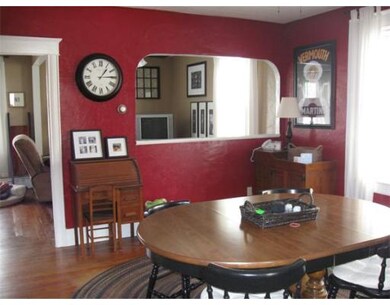
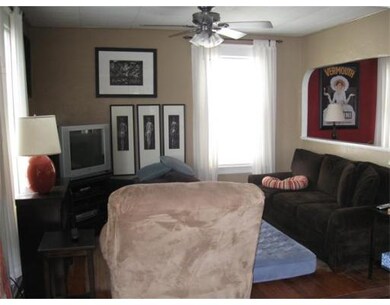
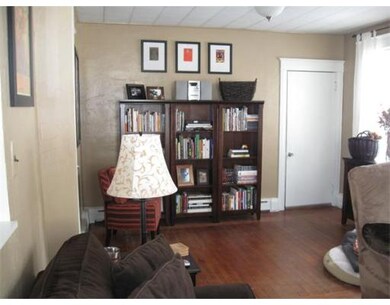
As of September 2017MAPLEWOOD TWO FAMILY- This well maintained home has two- 5 room/2 bedroom apts. with new roof, baseboard heat, modern boilers & updated elec. services. Both apartments are modern & tidy. The rear yard has new fencing and a 1 car garage. Just a short walk to Maplewood Park & shopping. This is not bank owned or a short sale.
Last Agent to Sell the Property
Michael McNally
Jack Carey and Associates Listed on: 01/01/2011
Similar Home in Fall River, MA
Create a Home Valuation Report for This Property
The Home Valuation Report is an in-depth analysis detailing your home's value as well as a comparison with similar homes in the area
Home Values in the Area
Average Home Value in this Area
Mortgage History
| Date | Status | Loan Amount | Loan Type |
|---|---|---|---|
| Closed | $166,920 | FHA | |
| Closed | $131,577 | New Conventional |
Source: Public Records
Property History
| Date | Event | Price | Change | Sq Ft Price |
|---|---|---|---|---|
| 09/21/2017 09/21/17 | Sold | $165,000 | -5.7% | $76 / Sq Ft |
| 07/31/2017 07/31/17 | Pending | -- | -- | -- |
| 07/17/2017 07/17/17 | Price Changed | $174,900 | -2.8% | $81 / Sq Ft |
| 06/30/2017 06/30/17 | For Sale | $179,900 | +33.3% | $83 / Sq Ft |
| 03/23/2012 03/23/12 | Sold | $135,000 | -28.6% | $63 / Sq Ft |
| 02/22/2012 02/22/12 | Pending | -- | -- | -- |
| 01/01/2011 01/01/11 | For Sale | $189,000 | -- | $88 / Sq Ft |
Source: MLS Property Information Network (MLS PIN)
Tax History Compared to Growth
Tax History
| Year | Tax Paid | Tax Assessment Tax Assessment Total Assessment is a certain percentage of the fair market value that is determined by local assessors to be the total taxable value of land and additions on the property. | Land | Improvement |
|---|---|---|---|---|
| 2025 | $4,281 | $373,900 | $108,200 | $265,700 |
| 2024 | $3,730 | $324,600 | $104,200 | $220,400 |
| 2023 | $3,209 | $261,500 | $86,100 | $175,400 |
| 2022 | $2,807 | $237,000 | $82,000 | $155,000 |
| 2021 | $2,807 | $203,000 | $78,000 | $125,000 |
| 2020 | $0 | $177,700 | $76,900 | $100,800 |
| 2019 | $2,445 | $167,700 | $74,000 | $93,700 |
| 2018 | $2,528 | $172,900 | $80,200 | $92,700 |
| 2017 | $2,299 | $164,200 | $76,400 | $87,800 |
| 2016 | $2,276 | $167,000 | $81,300 | $85,700 |
| 2015 | $2,184 | $167,000 | $81,300 | $85,700 |
| 2014 | $2,145 | $170,500 | $78,900 | $91,600 |
Source: Public Records
Agents Affiliated with this Home
-
Kenneth Mongeon
Seller's Agent in 2017
Kenneth Mongeon
KAM Realty
(508) 264-9811
6 in this area
149 Total Sales
-
Beth Fay
Buyer's Agent in 2017
Beth Fay
Lamacchia Realty, Inc.
(774) 644-5080
5 in this area
32 Total Sales
-
M
Seller's Agent in 2012
Michael McNally
Jack Carey and Associates
-
Dorothy Filipe
Buyer's Agent in 2012
Dorothy Filipe
High Pointe Properties
(508) 415-6121
12 Total Sales
Map
Source: MLS Property Information Network (MLS PIN)
MLS Number: 71174118
APN: FALL-000004E-000000-000099
Disclaimer: Certain information contained herein is derived from information provided by parties other than Homes.com. All information provided is deemed reliable, but is not guaranteed to be accurate and should be independently verified.
![]() The property listing data and information, or the Images, set forth herein were provided to MLS Property Information Network, Inc. from third party sources, including sellers, lessors and public records, and were compiled by MLS Property Information Network, Inc. The property listing data and information, and the Images, are for the personal, non-commercial use of consumers having a good faith interest in purchasing or leasing listed properties of the type displayed to them and may not be used for any purpose other than to identify prospective properties which such consumers may have a good faith interest in purchasing or leasing. MLS Property Information Network, Inc. and its subscribers disclaim any and all representations and warranties as to the accuracy of the property listing data and information, or as to the accuracy of any of the Images, set forth herein.
The property listing data and information, or the Images, set forth herein were provided to MLS Property Information Network, Inc. from third party sources, including sellers, lessors and public records, and were compiled by MLS Property Information Network, Inc. The property listing data and information, and the Images, are for the personal, non-commercial use of consumers having a good faith interest in purchasing or leasing listed properties of the type displayed to them and may not be used for any purpose other than to identify prospective properties which such consumers may have a good faith interest in purchasing or leasing. MLS Property Information Network, Inc. and its subscribers disclaim any and all representations and warranties as to the accuracy of the property listing data and information, or as to the accuracy of any of the Images, set forth herein.
Nearby Homes