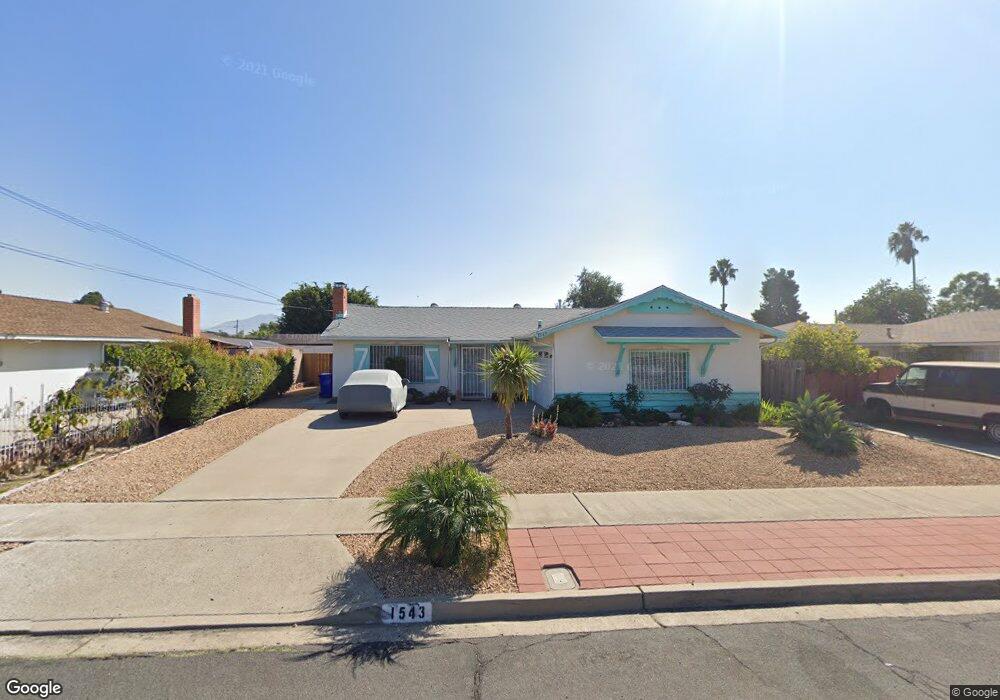
1543 Watwood Rd Lemon Grove, CA 91945
Estimated Value: $739,210 - $807,000
3
Beds
2
Baths
1,232
Sq Ft
$627/Sq Ft
Est. Value
About This Home
This home is located at 1543 Watwood Rd, Lemon Grove, CA 91945 and is currently estimated at $772,303, approximately $626 per square foot. 1543 Watwood Rd is a home located in San Diego County with nearby schools including Monterey Heights Elementary, Mount Miguel High School, and Keiller Leadership Academy.
Ownership History
Date
Name
Owned For
Owner Type
Purchase Details
Closed on
May 15, 2014
Sold by
Collins James T and Lagnado Candice J
Bought by
Patton Adolfina and Gomez Hector H
Current Estimated Value
Home Financials for this Owner
Home Financials are based on the most recent Mortgage that was taken out on this home.
Original Mortgage
$89,000
Outstanding Balance
$26,026
Interest Rate
3.34%
Mortgage Type
New Conventional
Estimated Equity
$746,277
Purchase Details
Closed on
Apr 21, 2010
Sold by
Collins James T
Bought by
Collins James T and Collins James T
Purchase Details
Closed on
Aug 31, 1998
Sold by
Collins Trust 01-20-94 and James T
Bought by
Collins James T
Purchase Details
Closed on
Jan 20, 1994
Sold by
Collins James T and Collins Della M
Bought by
Collins James T and Collins Della M
Create a Home Valuation Report for This Property
The Home Valuation Report is an in-depth analysis detailing your home's value as well as a comparison with similar homes in the area
Home Values in the Area
Average Home Value in this Area
Purchase History
| Date | Buyer | Sale Price | Title Company |
|---|---|---|---|
| Patton Adolfina | $305,000 | Chicago Title | |
| Collins James T | -- | None Available | |
| Collins James T | -- | -- | |
| Collins James T | -- | -- |
Source: Public Records
Mortgage History
| Date | Status | Borrower | Loan Amount |
|---|---|---|---|
| Open | Patton Adolfina | $89,000 |
Source: Public Records
Tax History Compared to Growth
Tax History
| Year | Tax Paid | Tax Assessment Tax Assessment Total Assessment is a certain percentage of the fair market value that is determined by local assessors to be the total taxable value of land and additions on the property. | Land | Improvement |
|---|---|---|---|---|
| 2025 | $2,478 | $158,306 | $105,466 | $52,840 |
| 2024 | $2,478 | $155,203 | $103,399 | $51,804 |
| 2023 | $2,424 | $152,161 | $101,372 | $50,789 |
| 2022 | $2,412 | $149,179 | $99,385 | $49,794 |
| 2021 | $2,384 | $146,255 | $97,437 | $48,818 |
| 2020 | $2,350 | $144,756 | $96,438 | $48,318 |
| 2019 | $2,307 | $141,919 | $94,548 | $47,371 |
| 2018 | $2,252 | $139,138 | $92,695 | $46,443 |
| 2017 | $150 | $136,411 | $90,878 | $45,533 |
| 2016 | $2,126 | $133,738 | $89,097 | $44,641 |
| 2015 | $2,132 | $311,093 | $104,008 | $207,085 |
| 2014 | $1,159 | $55,179 | $18,448 | $36,731 |
Source: Public Records
Map
Nearby Homes
- 1164 Woodrow Ave Unit 2
- 1062 Armacost Rd
- 1866 Massachusetts Ave
- 1817 Ramon St
- 1795 Lemon Grove Ave
- 1928 Noble St
- 1845 Madera St
- 1434 San Altos Place
- 1277 Glencoe Dr
- 7362 Marmil Place
- 7215 San Pasqual St
- 1935 Berry St
- 0 Dartmoor Dr Unit 1
- 2256 El Prado Ave
- 7087 Russan Ln
- 7420 Jamacha Rd
- 2363 Mcknight Dr
- 7083 Berry Park Ln
- 7065 Berry Park Ln
- 6859 Broadway Unit 1
- 1537 Watwood Rd
- 1549 Watwood Rd
- 1540 Larwood Rd
- 1546 Larwood Rd
- 1531 Watwood Rd
- 1534 Larwood Rd
- 1544 Watwood Rd
- 1538 Watwood Rd
- 1550 Watwood Rd
- 1528 Larwood Rd
- 1525 Watwood Rd
- 1601 Watwood Rd
- 1532 Watwood Rd
- 1556 Watwood Rd
- 1600 Larwood Rd
- 1522 Larwood Rd
- 1526 Watwood Rd
- 1547 Larwood Rd
- 1607 Watwood Rd
- 1519 Watwood Rd