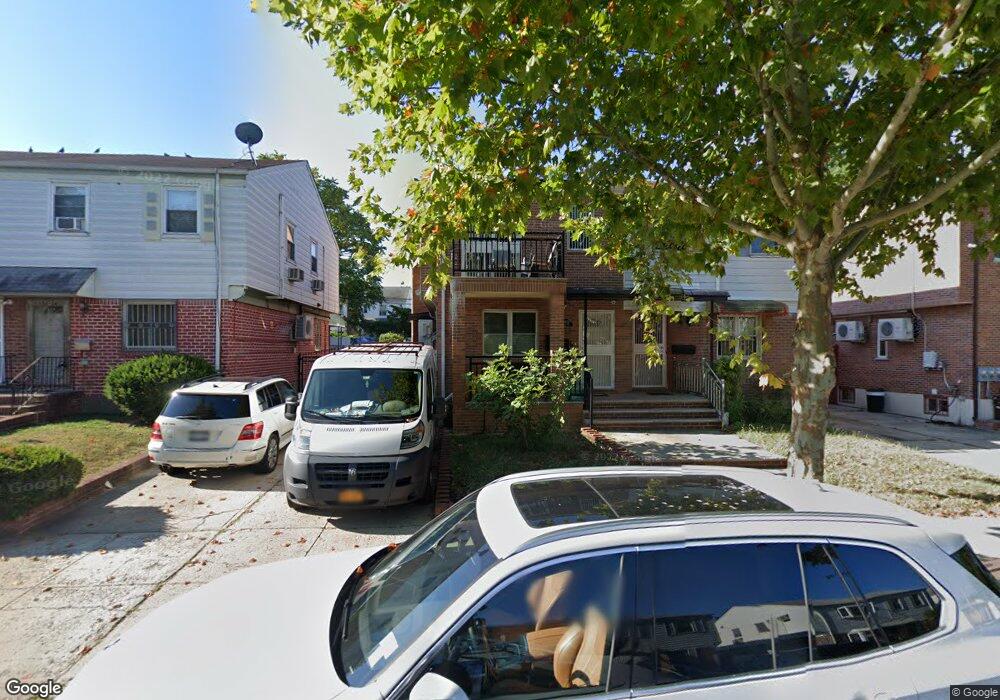
15432 58th Ave Flushing, NY 11355
Queensboro Hill NeighborhoodEstimated Value: $1,209,917 - $1,487,000
Studio
--
Bath
2,007
Sq Ft
$657/Sq Ft
Est. Value
About This Home
This home is located at 15432 58th Ave, Flushing, NY 11355 and is currently estimated at $1,319,229, approximately $657 per square foot. 15432 58th Ave is a home located in Queens County with nearby schools including P.S. 163 - Flushing Heights, Rachel Carson I.S. 237Q, and Francis Lewis High School.
Ownership History
Date
Name
Owned For
Owner Type
Purchase Details
Closed on
Jun 3, 2019
Sold by
Lin Jin Zhu and Liu Yi Chuan
Bought by
Liu Yi Chuan and Liu Zheng Dao
Current Estimated Value
Home Financials for this Owner
Home Financials are based on the most recent Mortgage that was taken out on this home.
Original Mortgage
$617,500
Outstanding Balance
$540,672
Interest Rate
4.1%
Mortgage Type
New Conventional
Estimated Equity
$778,557
Purchase Details
Closed on
Dec 27, 2007
Sold by
Augello Anthony and Augello Anthony J
Bought by
Lin Jin Zhu and Liu Yi Chuan
Home Financials for this Owner
Home Financials are based on the most recent Mortgage that was taken out on this home.
Original Mortgage
$362,500
Interest Rate
6.21%
Mortgage Type
Purchase Money Mortgage
Purchase Details
Closed on
Apr 21, 2005
Sold by
Augello Anthony
Bought by
Augello Anthony and Augello Ofelia C
Create a Home Valuation Report for This Property
The Home Valuation Report is an in-depth analysis detailing your home's value as well as a comparison with similar homes in the area
Home Values in the Area
Average Home Value in this Area
Purchase History
| Date | Buyer | Sale Price | Title Company |
|---|---|---|---|
| Liu Yi Chuan | -- | -- | |
| Liu Yi Chuan | -- | -- | |
| Liu Yi Chuan | -- | -- | |
| Lin Jin Zhu | $562,500 | -- | |
| Lin Jin Zhu | $562,500 | -- | |
| Augello Anthony | -- | -- | |
| Augello Anthony | -- | -- |
Source: Public Records
Mortgage History
| Date | Status | Borrower | Loan Amount |
|---|---|---|---|
| Open | Liu Yi Chuan | $617,500 | |
| Closed | Liu Yi Chuan | $617,500 | |
| Previous Owner | Lin Jin Zhu | $362,500 |
Source: Public Records
Tax History
| Year | Tax Paid | Tax Assessment Tax Assessment Total Assessment is a certain percentage of the fair market value that is determined by local assessors to be the total taxable value of land and additions on the property. | Land | Improvement |
|---|---|---|---|---|
| 2025 | $10,431 | $56,020 | $9,234 | $46,786 |
| 2024 | $9,782 | $53,332 | $9,775 | $43,557 |
| 2023 | $9,994 | $51,157 | $9,124 | $42,033 |
| 2022 | $8,666 | $67,980 | $14,340 | $53,640 |
| 2021 | $9,120 | $64,224 | $14,340 | $49,884 |
| 2020 | $7,295 | $54,240 | $14,340 | $39,900 |
| 2019 | $6,409 | $53,640 | $14,340 | $39,300 |
| 2018 | $5,863 | $30,223 | $9,308 | $20,915 |
| 2017 | $5,861 | $30,223 | $9,881 | $20,342 |
| 2016 | $5,686 | $30,223 | $9,881 | $20,342 |
| 2015 | $3,219 | $28,298 | $12,360 | $15,938 |
| 2014 | $3,219 | $26,697 | $12,372 | $14,325 |
Source: Public Records
Map
Nearby Homes
- 59-09 Kissena Blvd
- 59-41 156th St
- 153-51 Horace Harding Expy
- 54-29 153rd St
- 54-23 153rd St
- 150-40 60th Ave
- 159-08 59th Ave
- 6111 156th St
- 150-12 59th Ave
- 58-33 150th St
- 6113 156th St
- 5944 159th St
- 152-10 Peck Ave
- 152-12 Peck Ave
- 14849 58th Rd
- 150-01 Horace Harding Expy
- 155-17 65th Ave
- 140-19 Rose Ave
- 150-21 61st Rd
- 6143 157th St
- 15434 58th Ave
- 15430 58th Ave
- 15436 58th Ave
- 15426 58th Ave
- 15426 58th Ave Unit 1st Fl
- 15426 58th Ave Unit 1st Fl
- 15424 58th Ave
- 154-24 58th Ave
- 15424 58th Ave Unit 1Fl
- 154-24 58th Ave Unit 1Fl
- 154-24 58th Ave Unit 2Fl
- 15431 58th Rd
- 15422 58th Ave
- 15433 58th Rd
- 15429 58th Rd
- 15437 58th Rd
- 15427 58th Rd
- 15429 58th Rd
- 15437 58th Rd
- 154-20 58th Ave
Your Personal Tour Guide
Ask me questions while you tour the home.