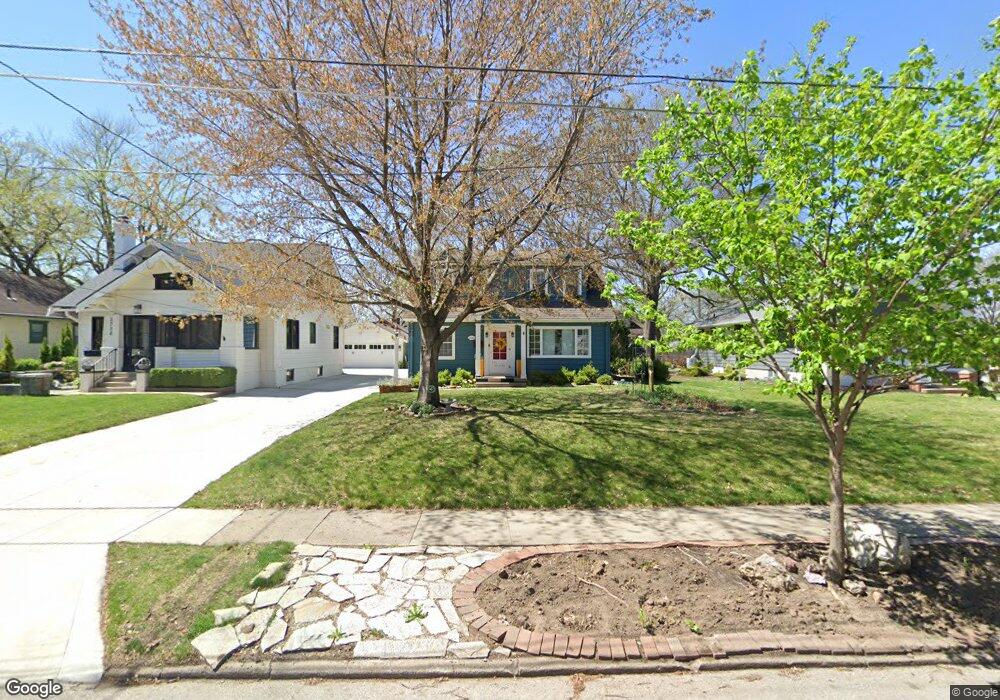
1544 47th St Des Moines, IA 50311
Waveland Park NeighborhoodEstimated Value: $257,000 - $286,000
3
Beds
2
Baths
1,310
Sq Ft
$207/Sq Ft
Est. Value
About This Home
This home is located at 1544 47th St, Des Moines, IA 50311 and is currently estimated at $271,302, approximately $207 per square foot. 1544 47th St is a home located in Polk County with nearby schools including Perkins Elementary School, Merrill Middle School, and Roosevelt High School.
Ownership History
Date
Name
Owned For
Owner Type
Purchase Details
Closed on
Nov 4, 2024
Sold by
Risen Bradley S and Risen Jan E
Bought by
Bradley S Risen Revocable Trust and Jan E Risen Revocable Trust
Current Estimated Value
Purchase Details
Closed on
Oct 28, 2024
Sold by
Welch Larissa I and Trail Lanny R
Bought by
Roland Aaron and Roland Erin
Create a Home Valuation Report for This Property
The Home Valuation Report is an in-depth analysis detailing your home's value as well as a comparison with similar homes in the area
Home Values in the Area
Average Home Value in this Area
Purchase History
| Date | Buyer | Sale Price | Title Company |
|---|---|---|---|
| Bradley S Risen Revocable Trust | -- | None Listed On Document | |
| Bradley S Risen Revocable Trust | -- | None Listed On Document | |
| Roland Aaron | $189,500 | None Listed On Document | |
| Roland Aaron | $189,500 | None Listed On Document |
Source: Public Records
Tax History Compared to Growth
Tax History
| Year | Tax Paid | Tax Assessment Tax Assessment Total Assessment is a certain percentage of the fair market value that is determined by local assessors to be the total taxable value of land and additions on the property. | Land | Improvement |
|---|---|---|---|---|
| 2025 | $4,560 | $269,200 | $49,800 | $219,400 |
| 2024 | $4,560 | $242,300 | $44,100 | $198,200 |
| 2023 | $4,674 | $242,300 | $44,100 | $198,200 |
| 2022 | $4,636 | $207,200 | $39,000 | $168,200 |
| 2021 | $4,542 | $207,200 | $39,000 | $168,200 |
| 2020 | $4,712 | $190,600 | $35,600 | $155,000 |
| 2019 | $4,328 | $190,600 | $35,600 | $155,000 |
| 2018 | $4,280 | $169,600 | $31,100 | $138,500 |
| 2017 | $3,952 | $169,600 | $31,100 | $138,500 |
| 2016 | $3,844 | $154,600 | $27,900 | $126,700 |
| 2015 | $3,844 | $154,600 | $27,900 | $126,700 |
| 2014 | $3,298 | $137,700 | $24,500 | $113,200 |
Source: Public Records
Map
Nearby Homes