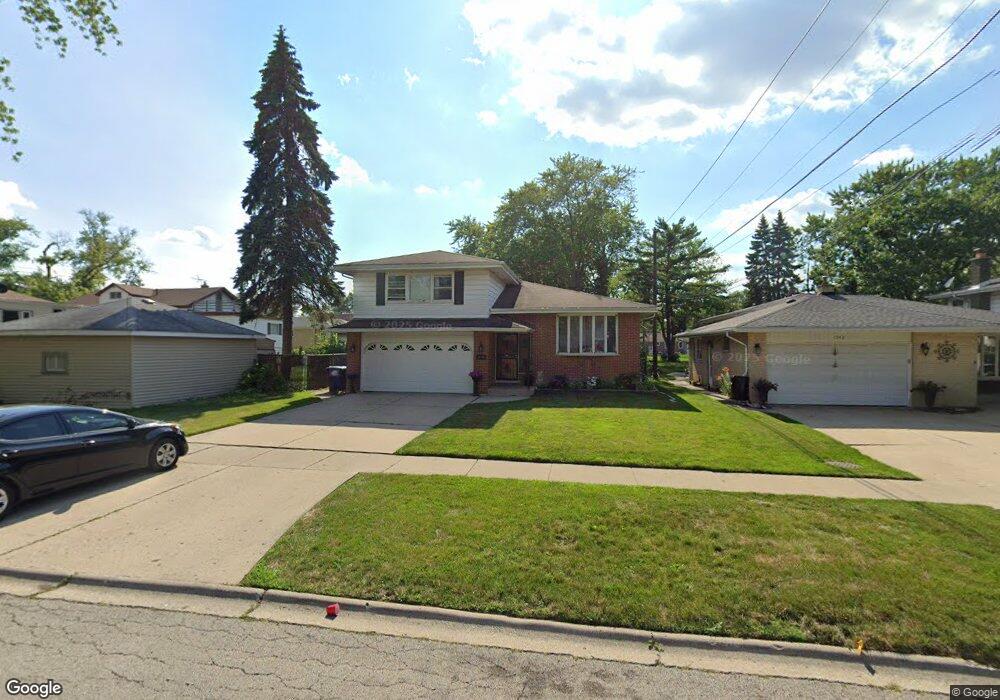
1544 King Dr Berkeley, IL 60163
Estimated Value: $310,000 - $350,000
3
Beds
2
Baths
1,353
Sq Ft
$247/Sq Ft
Est. Value
About This Home
This home is located at 1544 King Dr, Berkeley, IL 60163 and is currently estimated at $333,874, approximately $246 per square foot. 1544 King Dr is a home located in Cook County with nearby schools including Macarthur Intermediate School, Sunnyside Elementary School, and Proviso West High School.
Ownership History
Date
Name
Owned For
Owner Type
Purchase Details
Closed on
Aug 22, 2002
Sold by
Benson Nathaniel P
Bought by
Laye Rhonda D
Current Estimated Value
Home Financials for this Owner
Home Financials are based on the most recent Mortgage that was taken out on this home.
Original Mortgage
$190,000
Outstanding Balance
$77,287
Interest Rate
6.41%
Estimated Equity
$256,587
Purchase Details
Closed on
May 12, 1999
Sold by
Heise Lynn A
Bought by
Benson Nathaniel P
Home Financials for this Owner
Home Financials are based on the most recent Mortgage that was taken out on this home.
Original Mortgage
$154,800
Interest Rate
7.04%
Mortgage Type
Balloon
Purchase Details
Closed on
Aug 15, 1995
Sold by
Heise Lynn A and Navolio Robert P
Bought by
Navolio Charles Robert
Purchase Details
Closed on
Apr 15, 1995
Sold by
Navolio Charles Robert
Bought by
Navolio Heise Lynn Ann and Navolio Robert Paul
Create a Home Valuation Report for This Property
The Home Valuation Report is an in-depth analysis detailing your home's value as well as a comparison with similar homes in the area
Home Values in the Area
Average Home Value in this Area
Purchase History
| Date | Buyer | Sale Price | Title Company |
|---|---|---|---|
| Laye Rhonda D | $200,000 | Law Title | |
| Benson Nathaniel P | $172,000 | Prairie Title | |
| Navolio Charles Robert | -- | -- | |
| Navolio Heise Lynn Ann | $102,000 | -- |
Source: Public Records
Mortgage History
| Date | Status | Borrower | Loan Amount |
|---|---|---|---|
| Open | Laye Rhonda D | $190,000 | |
| Previous Owner | Benson Nathaniel P | $154,800 |
Source: Public Records
Tax History
| Year | Tax Paid | Tax Assessment Tax Assessment Total Assessment is a certain percentage of the fair market value that is determined by local assessors to be the total taxable value of land and additions on the property. | Land | Improvement |
|---|---|---|---|---|
| 2025 | $8,775 | $27,000 | $3,510 | $23,490 |
| 2024 | $8,775 | $27,000 | $3,510 | $23,490 |
| 2023 | $6,977 | $27,000 | $3,510 | $23,490 |
| 2022 | $6,977 | $19,304 | $3,031 | $16,273 |
| 2021 | $6,995 | $19,302 | $3,030 | $16,272 |
| 2020 | $6,690 | $19,302 | $3,030 | $16,272 |
| 2019 | $5,390 | $16,146 | $2,711 | $13,435 |
| 2018 | $6,130 | $18,188 | $2,711 | $15,477 |
| 2017 | $5,884 | $18,188 | $2,711 | $15,477 |
| 2016 | $4,950 | $14,727 | $2,392 | $12,335 |
| 2015 | $4,885 | $14,727 | $2,392 | $12,335 |
| 2014 | $4,818 | $14,727 | $2,392 | $12,335 |
| 2013 | $5,584 | $17,880 | $2,392 | $15,488 |
Source: Public Records
Map
Nearby Homes
- 1447 N Ashbel Ave
- 1428 1/2 N Ashbel Ave
- 1529 N Hillside Ave
- 4938 W Randolph St
- 5706 Saint Charles Rd
- 5700 Saint Charles Rd
- 4904 W Hawthorne Ave
- 5905 Superior St
- 504 N Irving Ave
- 5949 School St
- 605 N Wolf Rd Unit B9
- 520 N Wolf Rd Unit 203
- 593 S Edgewood Ave
- 768 N Rohde Ave
- 515 S Parkview Ave
- 1463 Speechley Blvd
- 250 N Irving Ave
- 2050 Atwood Ave
- 226 N Lind Ave
- 4530 Butterfield Rd
- 1542 King Dr
- 1540 King Dr
- 5724 W Hawthorne Ave
- 5728 W Hawthorne Ave
- 5732 W Hawthorne Ave
- 1538 King Dr
- 5736 W Hawthorne Ave
- 5736 W Hawthorne Ave
- 5710 W Hawthorne Ave
- 1541 King Dr
- 1536 King Dr
- 1539 King Dr
- 1535 King Dr
- 1541 N Taft Ave
- 5706 W Hawthorne Ave
- 1600 Birch Dr
- 1551 N Taft Ave
- 5725 W Hawthorne Ave
- 1537 N Taft Ave
- 5641 Murray Dr
Your Personal Tour Guide
Ask me questions while you tour the home.