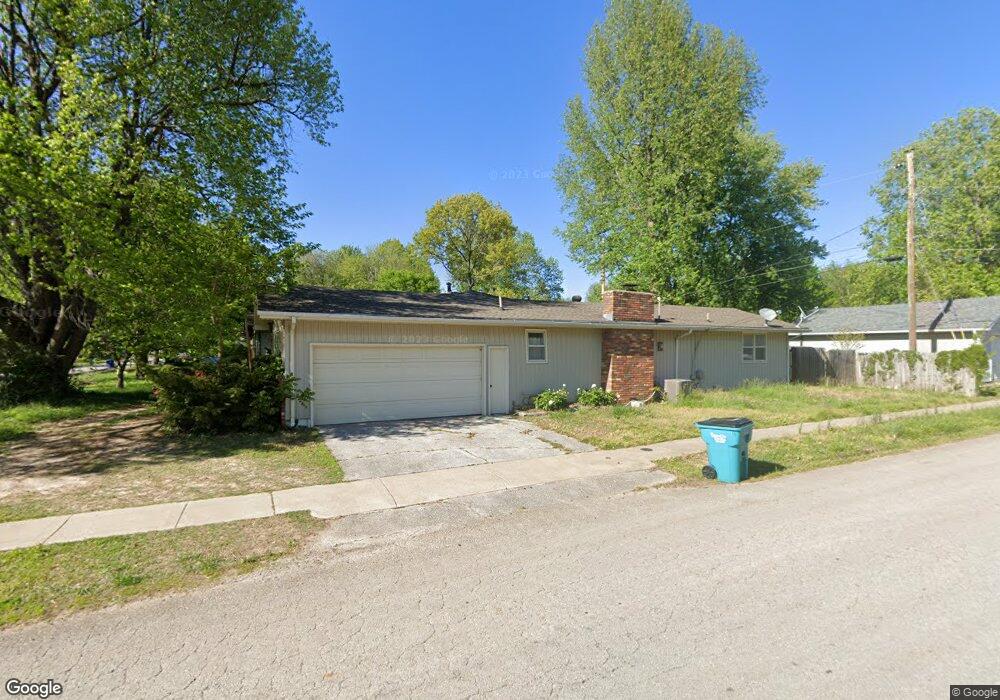
1544 S Saint Charles Ave Springfield, MO 65804
Oak Grove NeighborhoodEstimated Value: $267,000 - $297,000
4
Beds
3
Baths
1,970
Sq Ft
$144/Sq Ft
Est. Value
About This Home
This home is located at 1544 S Saint Charles Ave, Springfield, MO 65804 and is currently estimated at $283,216, approximately $143 per square foot. 1544 S Saint Charles Ave is a home located in Greene County with nearby schools including Pittman Elementary School, Hickory Hills K-8 School, and Glendale High School.
Ownership History
Date
Name
Owned For
Owner Type
Purchase Details
Closed on
Oct 24, 2025
Sold by
Bachelet Kathie and Maher Gena Louise
Bought by
Maher Gena Louise
Current Estimated Value
Purchase Details
Closed on
May 30, 2025
Sold by
Maher Gena Louise
Bought by
Alofia Real Estates Llc
Purchase Details
Closed on
Jun 3, 2016
Sold by
Moore Bean D and Moore Valerie May
Bought by
Bachelet Kathie
Home Financials for this Owner
Home Financials are based on the most recent Mortgage that was taken out on this home.
Original Mortgage
$150,818
Interest Rate
3.66%
Mortgage Type
VA
Purchase Details
Closed on
Jul 21, 2015
Sold by
Daily Kathleen
Bought by
Moore Beau D and Moore Valerie May
Home Financials for this Owner
Home Financials are based on the most recent Mortgage that was taken out on this home.
Original Mortgage
$117,727
Interest Rate
4.4%
Mortgage Type
FHA
Create a Home Valuation Report for This Property
The Home Valuation Report is an in-depth analysis detailing your home's value as well as a comparison with similar homes in the area
Home Values in the Area
Average Home Value in this Area
Purchase History
| Date | Buyer | Sale Price | Title Company |
|---|---|---|---|
| Maher Gena Louise | -- | None Listed On Document | |
| Alofia Real Estates Llc | -- | None Listed On Document | |
| Bachelet Kathie | -- | Continental Title | |
| Moore Beau D | -- | None Available |
Source: Public Records
Mortgage History
| Date | Status | Borrower | Loan Amount |
|---|---|---|---|
| Previous Owner | Bachelet Kathie | $150,818 | |
| Previous Owner | Moore Beau D | $117,727 |
Source: Public Records
Tax History Compared to Growth
Tax History
| Year | Tax Paid | Tax Assessment Tax Assessment Total Assessment is a certain percentage of the fair market value that is determined by local assessors to be the total taxable value of land and additions on the property. | Land | Improvement |
|---|---|---|---|---|
| 2025 | $1,751 | $36,120 | $5,700 | $30,420 |
| 2024 | $1,751 | $32,640 | $4,750 | $27,890 |
| 2023 | $1,741 | $32,640 | $4,750 | $27,890 |
| 2022 | $1,570 | $28,750 | $4,750 | $24,000 |
| 2021 | $1,570 | $28,750 | $4,750 | $24,000 |
| 2020 | $1,529 | $26,770 | $4,750 | $22,020 |
| 2019 | $1,486 | $26,770 | $4,750 | $22,020 |
| 2018 | $1,440 | $25,950 | $3,800 | $22,150 |
| 2017 | $1,425 | $23,160 | $3,800 | $19,360 |
| 2016 | $1,269 | $23,160 | $3,800 | $19,360 |
| 2015 | $1,258 | $23,160 | $3,800 | $19,360 |
| 2014 | $1,220 | $22,310 | $3,800 | $18,510 |
Source: Public Records
Map
Nearby Homes
- 1517 S John Ave
- 1635 S Estate Ave
- 1355 S Estate Ave
- 3130 E Meadowmere St
- 1837 S Sieger Dr
- 1320 S Raintree Place
- 3550 E Whitehall Dr
- 1254 S Belcrest Ave
- 1901 S Sieger Dr
- 1145 S John Ave
- 1967 S Saint Charles Ave
- 1144 S Paula Ave
- 1927 S Plaza Ave
- 1124 S Bruce Ave
- 1121 S John Ave
- 1304 S Meadowview Ave
- 1208 S Prince Ln
- 1159 S Belcrest Ave
- 1054 S Craig Ave
- 2726 S Catalina Ave
- 1544 S St Charles Ave
- 1536 S Saint Charles Ave
- 1543 S John Ave
- 1554 S Saint Charles Ave
- 1530 S St Charles Ave
- 1537 S John Ave
- 1530 S Saint Charles Ave
- 1543 S Saint Charles Ave
- 1537 S Saint Charles Ave
- 1531 S John Ave
- 1566 S Saint Charles Ave
- 3180 E Linwood St
- 3218 E Linwood St
- 1529 S Saint Charles Ave
- 1567 S Saint Charles Ave
- 1521 S John Ave
- 3177 E Linwood St
- 3232 E Linwood St
- 1521 S Saint Charles Ave
- 1570 S Saint Charles Ave