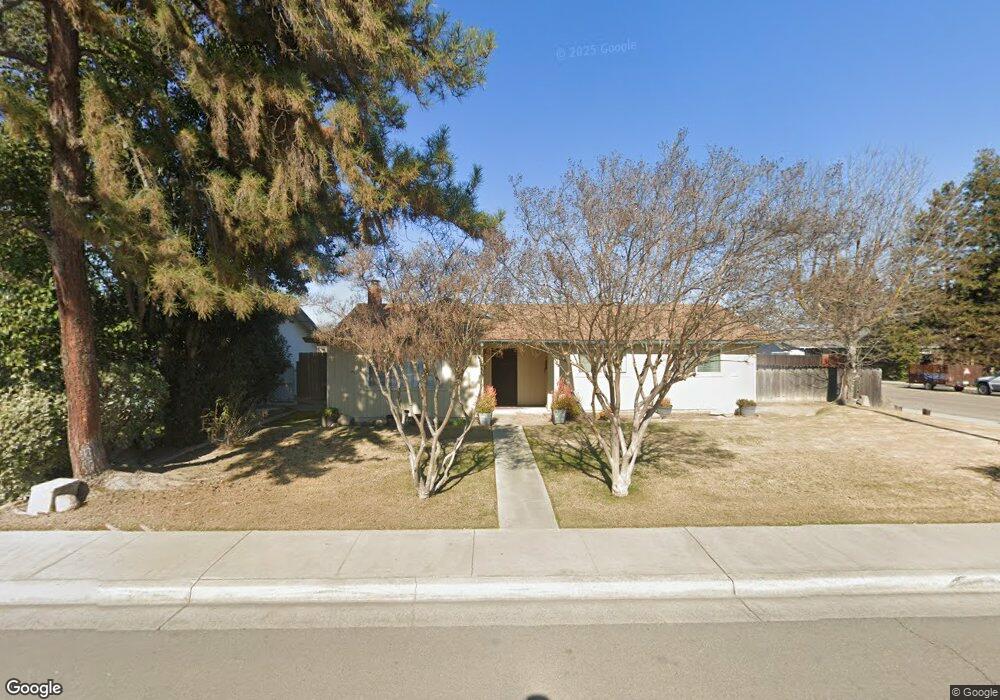
15440 W Kearney Blvd Kerman, CA 93630
Estimated Value: $340,000 - $378,883
3
Beds
2
Baths
1,408
Sq Ft
$254/Sq Ft
Est. Value
About This Home
This home is located at 15440 W Kearney Blvd, Kerman, CA 93630 and is currently estimated at $357,221, approximately $253 per square foot. 15440 W Kearney Blvd is a home located in Fresno County with nearby schools including Kerman-Floyd Elementary School.
Ownership History
Date
Name
Owned For
Owner Type
Purchase Details
Closed on
Sep 21, 2020
Sold by
Yniguez Cruz and Tapia Valeria
Bought by
Yniguez Cruz and Tapia Valeria
Current Estimated Value
Home Financials for this Owner
Home Financials are based on the most recent Mortgage that was taken out on this home.
Original Mortgage
$75,000
Outstanding Balance
$53,521
Interest Rate
2.9%
Mortgage Type
New Conventional
Estimated Equity
$303,700
Purchase Details
Closed on
Feb 3, 1999
Sold by
Delario Randolph Louis
Bought by
Yniguez Cruz and Tapia Valeria
Home Financials for this Owner
Home Financials are based on the most recent Mortgage that was taken out on this home.
Original Mortgage
$100,990
Interest Rate
6.79%
Mortgage Type
FHA
Purchase Details
Closed on
Jan 22, 1999
Sold by
Castillo Enrique V and Villalobos Henry S
Bought by
Delerio Randolph Louis
Home Financials for this Owner
Home Financials are based on the most recent Mortgage that was taken out on this home.
Original Mortgage
$100,990
Interest Rate
6.79%
Mortgage Type
FHA
Create a Home Valuation Report for This Property
The Home Valuation Report is an in-depth analysis detailing your home's value as well as a comparison with similar homes in the area
Home Values in the Area
Average Home Value in this Area
Purchase History
| Date | Buyer | Sale Price | Title Company |
|---|---|---|---|
| Yniguez Cruz | -- | Title365 Company | |
| Yniguez Cruz | $102,000 | Chicago Title Co | |
| Delerio Randolph Louis | $103,500 | Chicago Title Co |
Source: Public Records
Mortgage History
| Date | Status | Borrower | Loan Amount |
|---|---|---|---|
| Open | Yniguez Cruz | $75,000 | |
| Closed | Yniguez Cruz | $100,990 |
Source: Public Records
Tax History Compared to Growth
Tax History
| Year | Tax Paid | Tax Assessment Tax Assessment Total Assessment is a certain percentage of the fair market value that is determined by local assessors to be the total taxable value of land and additions on the property. | Land | Improvement |
|---|---|---|---|---|
| 2025 | $1,699 | $159,880 | $54,857 | $105,023 |
| 2023 | $1,687 | $153,674 | $52,728 | $100,946 |
| 2022 | $1,673 | $150,662 | $51,695 | $98,967 |
| 2021 | $1,626 | $147,709 | $50,682 | $97,027 |
| 2020 | $1,608 | $146,196 | $50,163 | $96,033 |
| 2019 | $1,596 | $143,330 | $49,180 | $94,150 |
| 2018 | $1,524 | $140,520 | $48,216 | $92,304 |
| 2017 | $1,509 | $137,766 | $47,271 | $90,495 |
| 2016 | $1,368 | $135,066 | $46,345 | $88,721 |
| 2015 | $1,355 | $133,038 | $45,649 | $87,389 |
| 2014 | $1,322 | $130,433 | $44,755 | $85,678 |
Source: Public Records
Map
Nearby Homes
- 505 S Del Norte Ave
- 15245 W El Mar Ln
- 16172 W David Ave
- 16180 W David Ave
- 220 S Madera Ave Unit SPC 9
- 15463 W B St
- 575 S 8th St
- 687 S 8th St
- 15906 W C St
- 16171 W Monterey Ave
- 16151 W Monterey Ave
- 14621 W C St
- 16052 W Middleton Ave
- 16101 W San Joaquin Ave
- 450 S Susan Ave
- 16477 W Kearney Blvd
- 14288 W El Mar Ave
- 15963 W Jensen Ave
- 251 N Trinity Ave
- 0 North
- 15450 W Kearney Blvd
- 15456 W Kearney Blvd
- 15447 W Monterey Ln
- 15434 W Kearney Blvd
- 15453 W Monterey Ln
- 15457 W Monterey Ln
- 15460 W Kearney Blvd
- 15435 W Monterey Ln
- 16098 W Monterey Ave
- 16040 W Monterey Ave
- 15426 W Kearney Blvd
- 15463 W Monterey Ln
- 15431 W Monterey Ln
- 15466 W Kearney Blvd
- 15420 W Kearney Blvd
- 15467 W Monterey Ln
- 15421 W Monterey Ln
- 15448 W Monterey Ln
- 15470 W Kearney Blvd
- 15454 W Monterey Ln