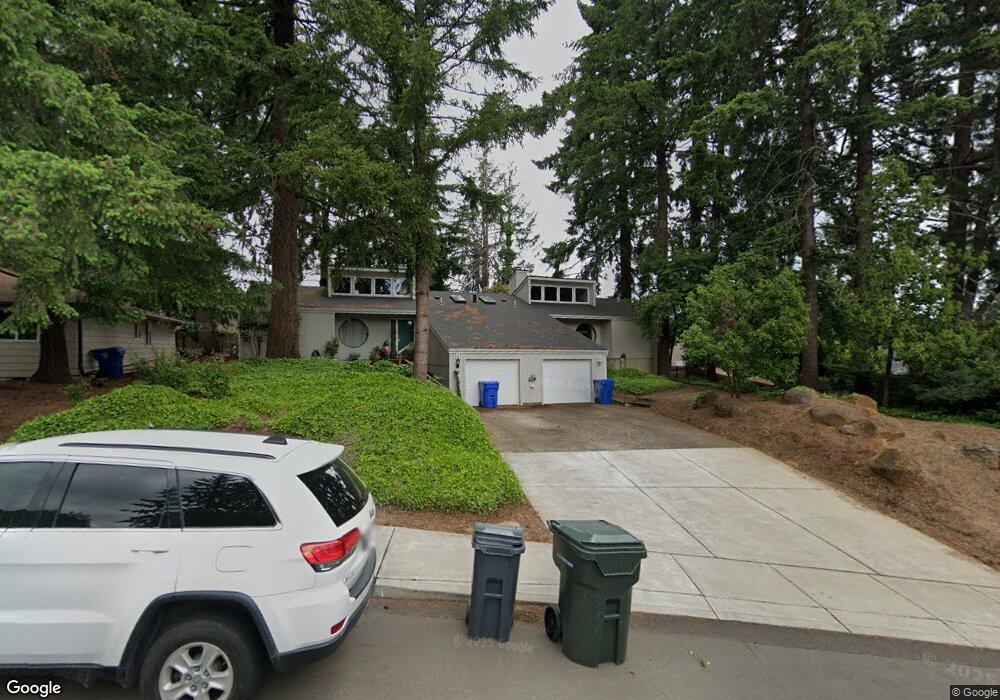
1545 & 1547 Distinctive Ct S Salem, OR 97306
Sunnyslope NeighborhoodEstimated Value: $478,000 - $501,492
2
Beds
1
Bath
1,066
Sq Ft
$463/Sq Ft
Est. Value
About This Home
This home is located at 1545 & 1547 Distinctive Ct S, Salem, OR 97306 and is currently estimated at $493,123, approximately $462 per square foot. 1545 & 1547 Distinctive Ct S is a home located in Marion County with nearby schools including Schirle Elementary School, Crossler Middle School, and Sprague High School.
Ownership History
Date
Name
Owned For
Owner Type
Purchase Details
Closed on
Oct 20, 2006
Sold by
Gurrera John and Gurrera Mindy
Bought by
Gurrera John and Gurrera Mindy W
Current Estimated Value
Purchase Details
Closed on
Oct 5, 2005
Sold by
Jenkins Rick L
Bought by
Gurrera John and Gurrera Mindy
Home Financials for this Owner
Home Financials are based on the most recent Mortgage that was taken out on this home.
Original Mortgage
$189,520
Outstanding Balance
$99,365
Interest Rate
5.63%
Mortgage Type
Fannie Mae Freddie Mac
Estimated Equity
$393,758
Purchase Details
Closed on
Jan 24, 2003
Sold by
Nelson Jenkins Carol Anne
Bought by
Jenkins Rick L
Purchase Details
Closed on
Jun 1, 2001
Sold by
Davis John E and Davis Marilyn C
Bought by
Jenkins Rick L and Nelson Jenkins Carol Anne
Home Financials for this Owner
Home Financials are based on the most recent Mortgage that was taken out on this home.
Original Mortgage
$123,600
Interest Rate
7.15%
Mortgage Type
Purchase Money Mortgage
Create a Home Valuation Report for This Property
The Home Valuation Report is an in-depth analysis detailing your home's value as well as a comparison with similar homes in the area
Home Values in the Area
Average Home Value in this Area
Purchase History
| Date | Buyer | Sale Price | Title Company |
|---|---|---|---|
| Gurrera John | -- | None Available | |
| Gurrera John | $236,900 | Fidelity National Title | |
| Jenkins Rick L | -- | -- | |
| Jenkins Rick L | $154,500 | Amerititle |
Source: Public Records
Mortgage History
| Date | Status | Borrower | Loan Amount |
|---|---|---|---|
| Open | Gurrera John | $189,520 | |
| Previous Owner | Jenkins Rick L | $123,600 |
Source: Public Records
Tax History Compared to Growth
Tax History
| Year | Tax Paid | Tax Assessment Tax Assessment Total Assessment is a certain percentage of the fair market value that is determined by local assessors to be the total taxable value of land and additions on the property. | Land | Improvement |
|---|---|---|---|---|
| 2025 | $4,877 | $255,820 | -- | -- |
| 2024 | $4,877 | $248,370 | -- | -- |
| 2023 | $4,733 | $241,140 | $0 | $0 |
| 2022 | $4,462 | $234,120 | $0 | $0 |
| 2021 | $4,335 | $227,310 | $0 | $0 |
| 2020 | $4,209 | $220,690 | $0 | $0 |
| 2019 | $4,061 | $214,270 | $0 | $0 |
| 2018 | $4,133 | $0 | $0 | $0 |
| 2017 | $3,730 | $0 | $0 | $0 |
| 2016 | $3,553 | $0 | $0 | $0 |
| 2015 | $3,546 | $0 | $0 | $0 |
| 2014 | $3,296 | $0 | $0 | $0 |
Source: Public Records
Map
Nearby Homes
- 4835 Talisman Ct S
- 1556 Joplin St S
- 1878 Joseph St S
- 4664 17th Ave S
- 4537 Kurth St S
- 1884 Skyline Village Loop S
- 2217 Juliet Ct S
- 1382 Kashmir Dr S
- 5042 Cumberland Ct SE Unit 18
- 5198 Skyline Rd S
- 4455 Matthews Loop S
- 2240 Joplin Ct S
- 5275 Parker Ct S
- 5270 Chapman St S
- 5125 Mountain Crest Way S
- 205 Rd Unit 37
- 2280 Kuebler Blvd
- 2280 Kuebler Rd S
- 5285 Anaconda Dr S
- 1874 Cedarcrest Dr S
- 1545 Distinctive Ct S Unit 1547
- 1555 Distinctive Ct S Unit 1557
- 4840 Talisman Ct (-4846) S
- 4844 Talisman Ct S
- 4830 Talisman Ct S Unit 4836
- 4805 Skyline Rd S
- 1540 Distinctive Ct S Unit 1542
- 4825 Skyline Rd S Unit 4827
- 1560 Distinctive Ct S Unit 1562
- 1565 Distinctive Ct S Unit 1567
- 1587 Distinctive Ct S Unit 1587
- 1570 Distinctive Ct S Unit 1572
- 1575 Distinctive (-1577) Ct S
- 1575 Distinctive Ct S Unit 1577
- 4825 Talisman Ct S
- 4815 14th Place S
- 1710 Juneau St S
- 1503 Skyline Way S
- 1523 Skyline Way S
- 1580 Distinctive Ct S Unit 1582