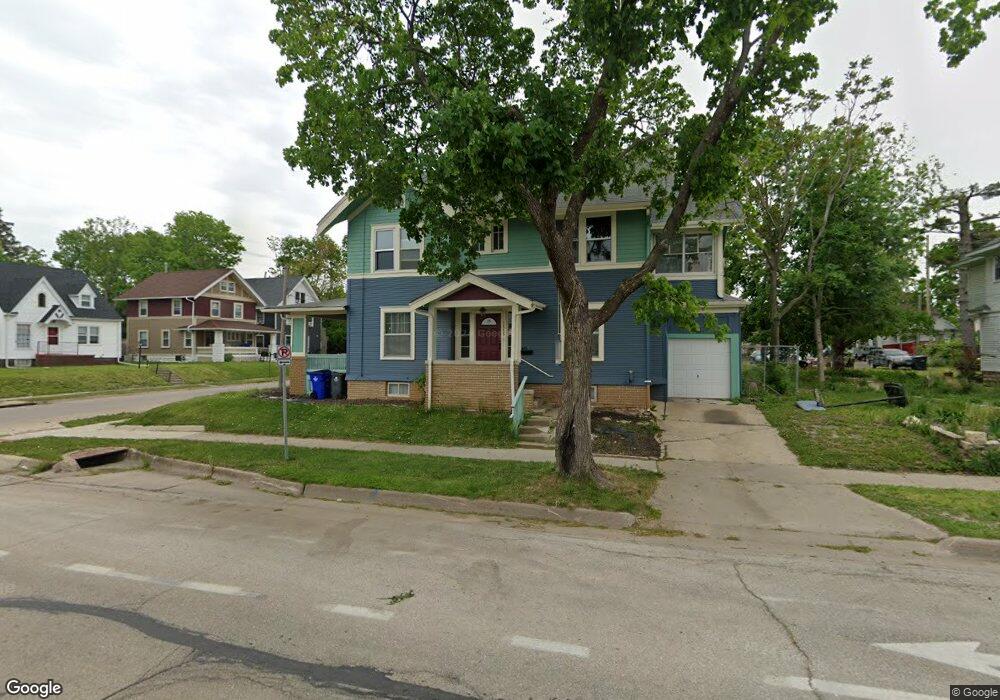
1545 2nd Ave SE Cedar Rapids, IA 52403
Wellington Heights NeighborhoodEstimated Value: $114,000 - $139,000
3
Beds
1
Bath
1,606
Sq Ft
$78/Sq Ft
Est. Value
About This Home
This home is located at 1545 2nd Ave SE, Cedar Rapids, IA 52403 and is currently estimated at $125,081, approximately $77 per square foot. 1545 2nd Ave SE is a home located in Linn County with nearby schools including Johnson STEAM Academy, McKinley STEAM Academy, and George Washington High School.
Ownership History
Date
Name
Owned For
Owner Type
Purchase Details
Closed on
Nov 17, 2017
Sold by
Koller Enterprises Llc
Bought by
D Taggart Holdings Inc
Current Estimated Value
Home Financials for this Owner
Home Financials are based on the most recent Mortgage that was taken out on this home.
Original Mortgage
$52,800
Outstanding Balance
$41,283
Interest Rate
3.88%
Mortgage Type
Future Advance Clause Open End Mortgage
Estimated Equity
$83,798
Purchase Details
Closed on
Nov 25, 2008
Sold by
Wm Specialty Mortgage Llc
Bought by
Koller Enterprises Llc
Purchase Details
Closed on
Aug 23, 2000
Sold by
Midamerica Housing Partnership
Bought by
Struchen Thomas Earl and Struchen Deborah K
Home Financials for this Owner
Home Financials are based on the most recent Mortgage that was taken out on this home.
Original Mortgage
$59,150
Interest Rate
8.26%
Mortgage Type
VA
Create a Home Valuation Report for This Property
The Home Valuation Report is an in-depth analysis detailing your home's value as well as a comparison with similar homes in the area
Home Values in the Area
Average Home Value in this Area
Purchase History
We collect this data history from publicly available records. To have your information removed, we recommend requesting removal directly through your county’s website.
| Date | Buyer | Sale Price | Title Company |
|---|---|---|---|
| D Taggart Holdings Inc | $35,000 | None Available | |
| Koller Enterprises Llc | $34,500 | None Available | |
| Struchen Thomas Earl | $57,500 | -- |
Source: Public Records
Mortgage History
We collect this data history from publicly available records. To have your information removed, we recommend requesting removal directly through your county’s website.
| Date | Status | Borrower | Loan Amount |
|---|---|---|---|
| Open | D Taggart Holdings Inc | $52,800 | |
| Previous Owner | Struchen Thomas Earl | $59,150 |
Source: Public Records
Tax History
| Year | Tax Paid | Tax Assessment Tax Assessment Total Assessment is a certain percentage of the fair market value that is determined by local assessors to be the total taxable value of land and additions on the property. | Land | Improvement |
|---|---|---|---|---|
| 2025 | $1,556 | $108,400 | $13,600 | $94,800 |
| 2024 | $1,708 | $99,400 | $11,900 | $87,500 |
| 2023 | $1,708 | $87,900 | $10,300 | $77,600 |
| 2022 | $1,498 | $81,000 | $10,300 | $70,700 |
| 2021 | $1,532 | $72,300 | $8,700 | $63,600 |
| 2020 | $1,532 | $69,400 | $8,700 | $60,700 |
| 2019 | $1,789 | $67,100 | $7,600 | $59,500 |
Source: Public Records
Map
Nearby Homes
- 1426 3rd Ave SE
- 1545 Washington Ave SE
- 1547 Washington Ave SE
- 120 17th St NE
- 8821 Zeppelin Ave NE
- 1701 Washington Ave SE
- 335 18th St SE
- 1730 Park Ave SE
- 216 17th St NE
- 1442 4th Ave SE
- 1418 4th Ave SE
- 1727 B Ave NE
- 1812 Park Ave SE
- 1615 4th Ave SE
- 1900 Park Ave SE
- 1645 D Ave NE
- 1906 Park Ave SE
- 371 19th St SE
- 509 15th St SE
- 509 14th St SE
- 205 Park Ct SE
- 209 Park Ct SE
- 1535 2nd Ave SE
- 211 Park Ct SE
- 1533 2nd Ave SE
- 204 Park Ct SE
- 208 Park Ct SE
- 1544 2nd Ave SE
- 1540 2nd Ave SE
- 217 Park Ct SE
- 212 Park Ct SE
- 1527 2nd Ave SE
- 1563 2nd Ave SE
- 1534 2nd Ave SE
- 1540 3rd Ave SE
- 1565 2nd Ave SE
- 1544 3rd Ave SE
- 1534 3rd Ave SE
- 1521 2nd Ave SE
- 1564 2nd Ave SE
Your Personal Tour Guide
Ask me questions while you tour the home.