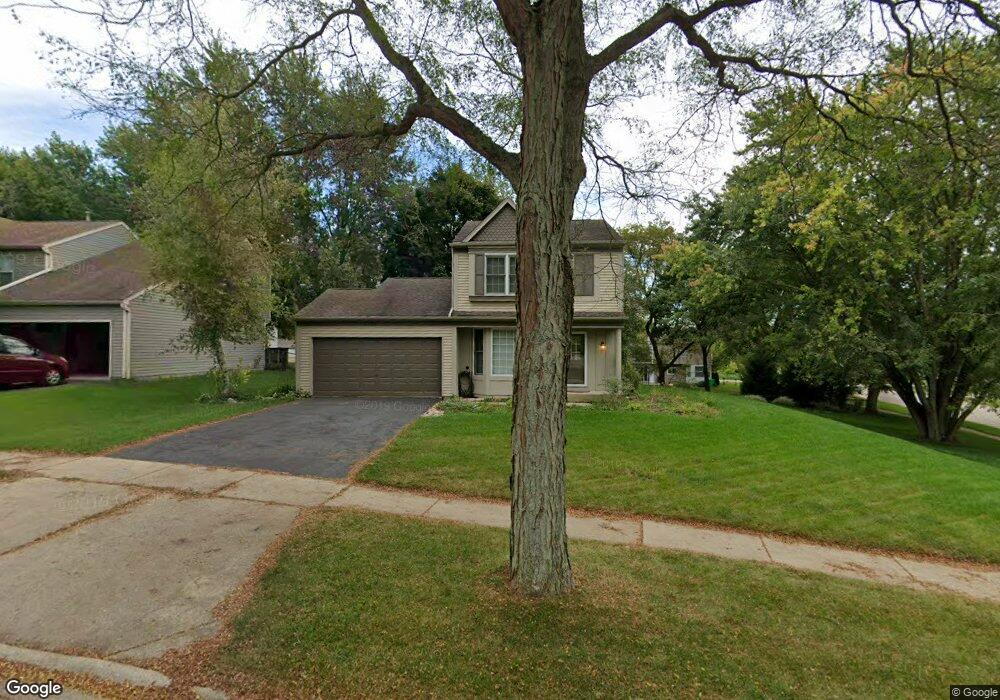
1545 Greenridge Ave Algonquin, IL 60102
Estimated Value: $306,150 - $327,000
3
Beds
--
Bath
1,194
Sq Ft
$264/Sq Ft
Est. Value
About This Home
This home is located at 1545 Greenridge Ave, Algonquin, IL 60102 and is currently estimated at $314,788, approximately $263 per square foot. 1545 Greenridge Ave is a home located in Kane County with nearby schools including Algonquin Lakes Elementary School, Algonquin Middle School, and Dundee-Crown High School.
Ownership History
Date
Name
Owned For
Owner Type
Purchase Details
Closed on
Oct 15, 2004
Sold by
Ernst Rita A
Bought by
Harrison Rita A
Current Estimated Value
Home Financials for this Owner
Home Financials are based on the most recent Mortgage that was taken out on this home.
Original Mortgage
$35,727
Interest Rate
5.9%
Mortgage Type
Purchase Money Mortgage
Purchase Details
Closed on
Mar 26, 2004
Sold by
Ernst David
Bought by
Ernst Rita A
Home Financials for this Owner
Home Financials are based on the most recent Mortgage that was taken out on this home.
Original Mortgage
$105,000
Interest Rate
3.87%
Mortgage Type
New Conventional
Create a Home Valuation Report for This Property
The Home Valuation Report is an in-depth analysis detailing your home's value as well as a comparison with similar homes in the area
Home Values in the Area
Average Home Value in this Area
Purchase History
| Date | Buyer | Sale Price | Title Company |
|---|---|---|---|
| Harrison Rita A | -- | American Title Corp | |
| Ernst Rita A | -- | Lawyers Title Insurance Co |
Source: Public Records
Mortgage History
| Date | Status | Borrower | Loan Amount |
|---|---|---|---|
| Previous Owner | Harrison Rita A | $35,727 | |
| Previous Owner | Ernst Rita A | $105,000 |
Source: Public Records
Tax History Compared to Growth
Tax History
| Year | Tax Paid | Tax Assessment Tax Assessment Total Assessment is a certain percentage of the fair market value that is determined by local assessors to be the total taxable value of land and additions on the property. | Land | Improvement |
|---|---|---|---|---|
| 2024 | $5,260 | $82,923 | $26,492 | $56,431 |
| 2023 | $4,932 | $74,612 | $23,837 | $50,775 |
| 2022 | $4,193 | $67,944 | $23,837 | $44,107 |
| 2021 | $4,736 | $64,153 | $22,507 | $41,646 |
| 2020 | $4,347 | $62,711 | $22,001 | $40,710 |
| 2019 | $4,910 | $59,532 | $20,886 | $38,646 |
| 2018 | $4,775 | $56,155 | $20,472 | $35,683 |
| 2017 | $4,606 | $52,531 | $19,151 | $33,380 |
| 2016 | $4,384 | $47,749 | $17,971 | $29,778 |
| 2015 | -- | $44,742 | $16,839 | $27,903 |
| 2014 | -- | $42,717 | $16,374 | $26,343 |
| 2013 | -- | $44,024 | $16,875 | $27,149 |
Source: Public Records
Map
Nearby Homes
- 1535 Teri Ln
- 1715 Riverwood Dr
- 601 Lake Cornish Way
- lot 25 Wabican Trail
- 9999 Sandbloom Rd
- 400 Diamond Back Way
- 0 Natoma Trail
- 69 Alice St
- 1245 Winaki Trail
- 460 Mahogany Dr
- 1551 Glacier Trail Unit 644
- 451 Mahogany Dr
- 2003 Magenta Ln
- Lot 4 b Ryan Pkwy
- 1770 E Algonquin Rd
- 1309 Silverstone Dr Unit 1305
- 1303 Silverstone Dr Unit 1302
- 713 Silverstone Dr Unit 77
- 1659 E Algonquin Rd
- 2 Sunset Ln
- 1535 Greenridge Ave
- 1560 Meghan Ave
- 1550 Meghan Ave
- 1540 Meghan Ave
- 1525 Greenridge Ave
- 1500 Riverwood Dr
- 1460 Riverwood Dr
- 1530 Meghan Ave
- 1510 Riverwood Dr
- 1450 Riverwood Dr
- 1520 Riverwood Dr
- 1520 Meghan Ave
- 1455 Riverwood Dr Unit 3
- 1515 Greenridge Ave
- 1440 Riverwood Dr
- 1510 Meghan Ave
- 1530 Riverwood Dr
- 1445 Riverwood Dr
- 1599 Meghan Ave
- 1505 Greenridge Ave