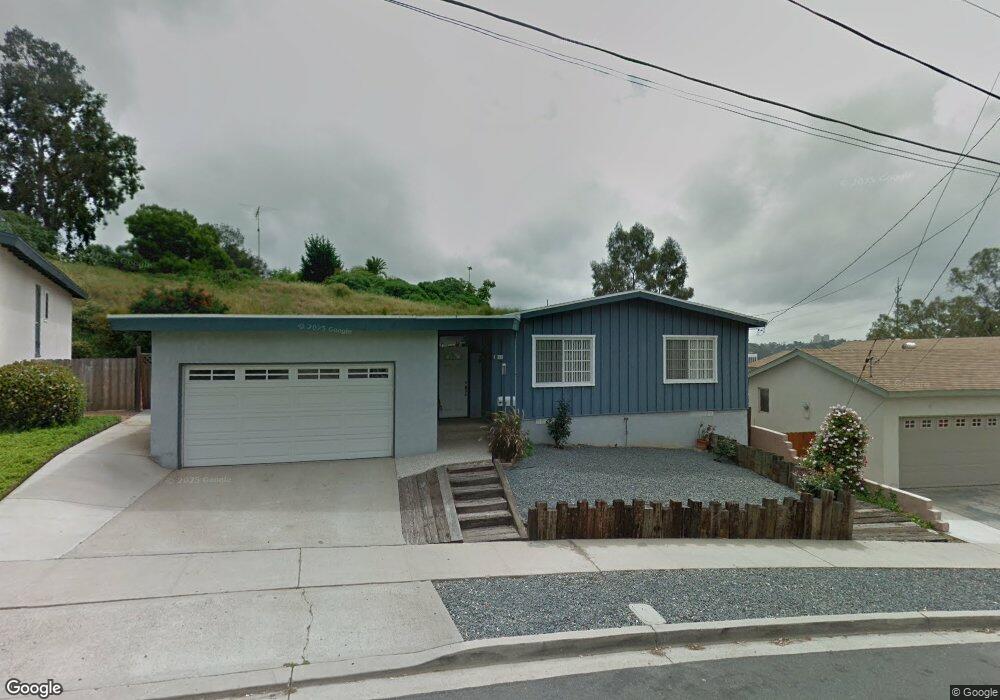
1545 Linbrook Dr San Diego, CA 92111
Linda Vista NeighborhoodEstimated Value: $897,716 - $1,018,000
3
Beds
1
Bath
1,120
Sq Ft
$861/Sq Ft
Est. Value
About This Home
This home is located at 1545 Linbrook Dr, San Diego, CA 92111 and is currently estimated at $963,929, approximately $860 per square foot. 1545 Linbrook Dr is a home located in San Diego County with nearby schools including Carson Elementary School, Montgomery Middle School, and Empower Language Academy.
Ownership History
Date
Name
Owned For
Owner Type
Purchase Details
Closed on
Mar 10, 2020
Sold by
Souto Daniel
Bought by
Souto Children S Trust Of 2020
Current Estimated Value
Purchase Details
Closed on
Dec 6, 2000
Sold by
Souto Catalina
Bought by
Souto Daniel
Home Financials for this Owner
Home Financials are based on the most recent Mortgage that was taken out on this home.
Original Mortgage
$160,000
Outstanding Balance
$58,834
Interest Rate
7.67%
Estimated Equity
$905,095
Purchase Details
Closed on
Feb 3, 1997
Sold by
Muhlerwirth Ken and Muhlerwirth Patricia
Bought by
Souto Daniel and Souto Catalina
Home Financials for this Owner
Home Financials are based on the most recent Mortgage that was taken out on this home.
Original Mortgage
$126,074
Interest Rate
7.66%
Mortgage Type
FHA
Create a Home Valuation Report for This Property
The Home Valuation Report is an in-depth analysis detailing your home's value as well as a comparison with similar homes in the area
Home Values in the Area
Average Home Value in this Area
Purchase History
| Date | Buyer | Sale Price | Title Company |
|---|---|---|---|
| Souto Children S Trust Of 2020 | -- | None Available | |
| Souto Daniel | -- | Gateway Title Company | |
| Souto Daniel | $137,000 | Chicago Title Company |
Source: Public Records
Mortgage History
| Date | Status | Borrower | Loan Amount |
|---|---|---|---|
| Open | Souto Daniel | $160,000 | |
| Closed | Souto Daniel | $126,074 |
Source: Public Records
Tax History Compared to Growth
Tax History
| Year | Tax Paid | Tax Assessment Tax Assessment Total Assessment is a certain percentage of the fair market value that is determined by local assessors to be the total taxable value of land and additions on the property. | Land | Improvement |
|---|---|---|---|---|
| 2025 | $2,757 | $223,103 | $174,259 | $48,844 |
| 2024 | $2,757 | $218,730 | $170,843 | $47,887 |
| 2023 | $2,697 | $214,443 | $167,494 | $46,949 |
| 2022 | $2,624 | $210,239 | $164,210 | $46,029 |
| 2021 | $2,603 | $206,118 | $160,991 | $45,127 |
| 2020 | $2,568 | $204,006 | $159,341 | $44,665 |
| 2019 | $2,520 | $200,007 | $156,217 | $43,790 |
| 2018 | $2,359 | $196,086 | $153,154 | $42,932 |
| 2017 | $2,303 | $192,242 | $150,151 | $42,091 |
| 2016 | $2,262 | $188,473 | $147,207 | $41,266 |
| 2015 | $2,229 | $185,643 | $144,996 | $40,647 |
| 2014 | $2,195 | $182,007 | $142,156 | $39,851 |
Source: Public Records
Map
Nearby Homes
- 7247 Camino Degrazia Unit 44
- 7248 Camino Degrazia Unit 297
- 7228 Camino Degrazia Unit 271
- 7283 Camino Degrazia Unit 11
- 7087 Camino Degrazia Unit 141
- 7067 Camino Revueltos Unit 312
- 7047 Camino Degrazia Unit 188
- 7263 Camino Degrazia Unit 33
- 6974 Camino Pacheco
- 6972 Glidden St
- 7577 Hazard Center Dr
- 7561 Hazard Center Dr Unit 29
- 1576 Acheson St
- 1472 Camino Lujan
- 1545 Northrim Ct Unit 272
- 7673 Hazard Center Dr Unit 55
- 510 Camino de la Reina Unit 102
- 640 Camino de la Reina Unit 1401
- 640 Camino de la Reina Unit 1309
- 2005 Burton St Unit 1
- 1535 Linbrook Dr
- 1555 Linbrook Dr
- 1565 Linbrook Dr
- 1570 Linbrook Dr
- 1544 Linbrook Dr
- 1530 Minden Dr
- 1516 Minden Dr
- 1544 Minden Dr
- 1575 Linbrook Dr
- 1556 Minden Dr
- 1448 Minden Dr
- 1601 Linbrook Dr
- 1612 Linbrook Dr
- 7280 Acari St
- 7270 Acari St
- 1434 Minden Dr
- 1614 Minden Dr
- 1615 Linbrook Dr
- 1626 Minden Dr
- 1529 Minden Dr