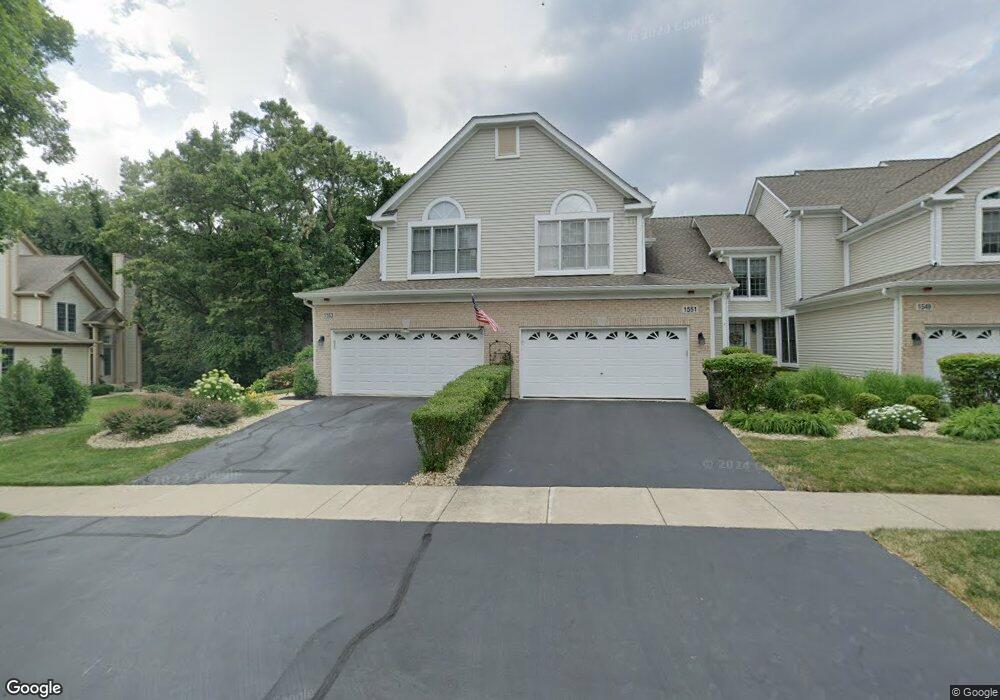
1545 Treeline Ct Unit 905 Naperville, IL 60565
Meadow Glens NeighborhoodEstimated Value: $398,176 - $421,000
--
Bed
2
Baths
1,617
Sq Ft
$253/Sq Ft
Est. Value
About This Home
This home is located at 1545 Treeline Ct Unit 905, Naperville, IL 60565 and is currently estimated at $409,544, approximately $253 per square foot. 1545 Treeline Ct Unit 905 is a home located in DuPage County with nearby schools including Maplebrook Elementary School, Lincoln Jr. High School, and Naperville Central High School.
Ownership History
Date
Name
Owned For
Owner Type
Purchase Details
Closed on
Aug 2, 2021
Sold by
Kobialka Albert R
Bought by
Leavenworth Gary and Leavenworth Pamela
Current Estimated Value
Home Financials for this Owner
Home Financials are based on the most recent Mortgage that was taken out on this home.
Original Mortgage
$210,000
Interest Rate
2.99%
Mortgage Type
New Conventional
Purchase Details
Closed on
Oct 10, 1995
Sold by
Wiseman Hughes Enterprises Inc
Bought by
Kobialka Arthur H and Kobialka Alberta R
Home Financials for this Owner
Home Financials are based on the most recent Mortgage that was taken out on this home.
Original Mortgage
$120,000
Interest Rate
7.25%
Mortgage Type
Purchase Money Mortgage
Create a Home Valuation Report for This Property
The Home Valuation Report is an in-depth analysis detailing your home's value as well as a comparison with similar homes in the area
Home Values in the Area
Average Home Value in this Area
Purchase History
| Date | Buyer | Sale Price | Title Company |
|---|---|---|---|
| Leavenworth Gary | $300,000 | Attorneys Ttl Guaranty Fund | |
| Kobialka Arthur H | $170,000 | -- |
Source: Public Records
Mortgage History
| Date | Status | Borrower | Loan Amount |
|---|---|---|---|
| Previous Owner | Leavenworth Gary | $210,000 | |
| Previous Owner | Kobialka Arthur H | $120,000 |
Source: Public Records
Tax History Compared to Growth
Tax History
| Year | Tax Paid | Tax Assessment Tax Assessment Total Assessment is a certain percentage of the fair market value that is determined by local assessors to be the total taxable value of land and additions on the property. | Land | Improvement |
|---|---|---|---|---|
| 2024 | $6,851 | $127,835 | $26,713 | $101,122 |
| 2023 | $6,541 | $116,670 | $24,380 | $92,290 |
| 2022 | $6,152 | $106,060 | $22,160 | $83,900 |
| 2021 | $5,910 | $102,050 | $21,320 | $80,730 |
| 2020 | $5,776 | $100,220 | $20,940 | $79,280 |
| 2019 | $5,587 | $95,880 | $20,030 | $75,850 |
| 2018 | $5,664 | $97,030 | $20,270 | $76,760 |
| 2017 | $5,534 | $93,760 | $19,590 | $74,170 |
| 2016 | $5,406 | $90,370 | $18,880 | $71,490 |
| 2015 | $5,342 | $85,100 | $17,780 | $67,320 |
| 2014 | $5,288 | $82,040 | $17,140 | $64,900 |
| 2013 | $5,210 | $82,240 | $17,180 | $65,060 |
Source: Public Records
Map
Nearby Homes
- 1449 Whitespire Ct Unit 5104
- 456 Timber Trail Ct
- 431 Orleans Ave
- 158 E Bailey Rd Unit F
- 144 E Bailey Rd Unit L
- 8S452 Bell Dr
- 128 E Bailey Rd Unit G
- 138 E Bailey Rd Unit M
- 621 Bourbon Ct
- 1721 S Washington St Unit 1721
- 1751 S Washington St Unit 1
- 1408 Swallow St
- 517 Sheffield Rd
- 1717 Drake Ct
- 1323 Auburn Ave
- 1340 Auburn Ave
- 302 Carriage Hill Rd
- 213 Winding Creek Dr
- 1921 Wisteria Ct Unit 3
- 1519 77th St
- 522 Harlowe Ln Unit 1902
- 1548 Treeline Ct Unit 404
- 1407 Whitespire Ct Unit 5001
- 550 Harlowe Ln Unit 1701A
- 421 Harlowe Ln Unit 3601
- 1553 Treeline Ct Unit 901D
- 1576 Treeline Ct Unit 603
- 543 Harlowe Ln Unit 3201
- 409 Harlowe Ln Unit 2304
- 425 Harlowe Ln Unit 3603
- 1416 Whitespire Ct Unit 4801
- 407 Harlowe Ln Unit 2303
- 1523 Orchard Cir Unit 2804
- 403 Harlowe Ln Unit 2301
- 1405 Whitespire Ct Unit 5002
- 1552 Treeline Ct Unit 402
- 1566 Treeline Ct Unit 504
- 1546 Treeline Ct Unit 405
- 546 Harlowe Ln Unit 1703
- 423 Harlowe Ln Unit 3602