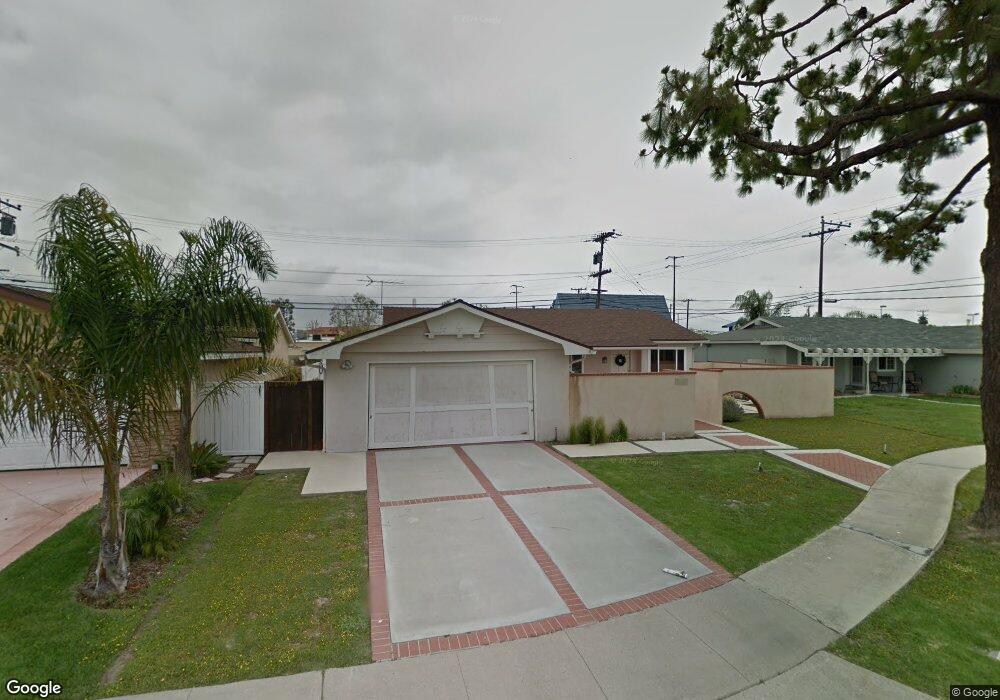
15452 Duke Cir Huntington Beach, CA 92647
Estimated Value: $1,081,900 - $1,172,000
4
Beds
2
Baths
1,182
Sq Ft
$954/Sq Ft
Est. Value
About This Home
This home is located at 15452 Duke Cir, Huntington Beach, CA 92647 and is currently estimated at $1,127,975, approximately $954 per square foot. 15452 Duke Cir is a home located in Orange County with nearby schools including Schroeder Elementary School, Helen Stacey Intermediate School, and Marina High School.
Ownership History
Date
Name
Owned For
Owner Type
Purchase Details
Closed on
Jul 26, 2005
Sold by
Ferrero Nathalie E
Bought by
Ferrero Nathalie Ettora and The Nathalie Ettora Ferrero Revocable Li
Current Estimated Value
Purchase Details
Closed on
Apr 12, 2000
Sold by
Andrea Cole
Bought by
Ferrero Nathalie E
Home Financials for this Owner
Home Financials are based on the most recent Mortgage that was taken out on this home.
Original Mortgage
$132,000
Outstanding Balance
$45,255
Interest Rate
8.24%
Estimated Equity
$1,082,720
Purchase Details
Closed on
Jun 11, 1998
Sold by
Ferrero Nathalie E and Cole Andrea
Bought by
Ferrero Nathalie E and Cole Andrea M
Home Financials for this Owner
Home Financials are based on the most recent Mortgage that was taken out on this home.
Original Mortgage
$10,000
Interest Rate
7.17%
Mortgage Type
Stand Alone Second
Purchase Details
Closed on
Oct 21, 1987
Sold by
John Ferrero
Bought by
Ferrero Nathalie E and Cole Andrea M
Create a Home Valuation Report for This Property
The Home Valuation Report is an in-depth analysis detailing your home's value as well as a comparison with similar homes in the area
Home Values in the Area
Average Home Value in this Area
Purchase History
| Date | Buyer | Sale Price | Title Company |
|---|---|---|---|
| Ferrero Nathalie Ettora | -- | -- | |
| Ferrero Nathalie E | -- | American Title Co | |
| Ferrero Nathalie E | -- | -- | |
| Ferrero Nathalie E | -- | -- |
Source: Public Records
Mortgage History
| Date | Status | Borrower | Loan Amount |
|---|---|---|---|
| Open | Ferrero Nathalie E | $132,000 | |
| Previous Owner | Ferrero Nathalie E | $10,000 |
Source: Public Records
Tax History Compared to Growth
Tax History
| Year | Tax Paid | Tax Assessment Tax Assessment Total Assessment is a certain percentage of the fair market value that is determined by local assessors to be the total taxable value of land and additions on the property. | Land | Improvement |
|---|---|---|---|---|
| 2025 | $2,745 | $220,195 | $161,280 | $58,915 |
| 2024 | $2,745 | $215,878 | $158,118 | $57,760 |
| 2023 | $2,650 | $211,646 | $155,018 | $56,628 |
| 2022 | $2,606 | $207,497 | $151,979 | $55,518 |
| 2021 | $2,551 | $203,429 | $148,999 | $54,430 |
| 2020 | $2,519 | $201,344 | $147,472 | $53,872 |
| 2019 | $2,491 | $197,397 | $144,581 | $52,816 |
| 2018 | $2,487 | $193,527 | $141,746 | $51,781 |
| 2017 | $2,394 | $189,733 | $138,967 | $50,766 |
| 2016 | $2,320 | $186,013 | $136,242 | $49,771 |
| 2015 | $2,278 | $183,219 | $134,195 | $49,024 |
| 2014 | $2,225 | $179,630 | $131,566 | $48,064 |
Source: Public Records
Map
Nearby Homes
- 15801 Carrie Ln
- 15012 Hanover Ln
- 6522 Limerick Dr
- 6781 Retherford Dr
- 15722 Dawson Ln
- 15072 Sussex Cir
- 14862 Sabre Ln
- 6631 Walton Dr
- 6022 Larchwood Dr
- 16081 Windemeir Ln
- 6101 Jade Cir
- 7221 Siena Ave
- 14621 Chalet Ln
- 15192 Vermont St
- 5751 Mangrum Dr
- 16261 Angler Ln
- 7223 Alchemy Cir
- 7252 Ellington Dr
- 7231 Alchemy Cir
- 7248 Aura Cir
- 15442 Duke Cir
- 15472 Duke Cir
- 6441 Mcfadden Ave
- 15432 Duke Cir
- 15451 Duke Cir
- 15441 Duke Cir
- 15471 Duke Cir
- 15422 Duke Cir
- 15431 Edwards St
- 15431 Duke Cir
- 15402 Duke Cir
- 15421 Duke Cir
- 15452 Columbia Ln
- 15502 Toway Ln
- 15442 Columbia Ln
- 15472 Columbia Ln
- 15421 Edwards St
- 15432 Columbia Ln
- 15401 Duke Cir
- 6442 Citadel Dr