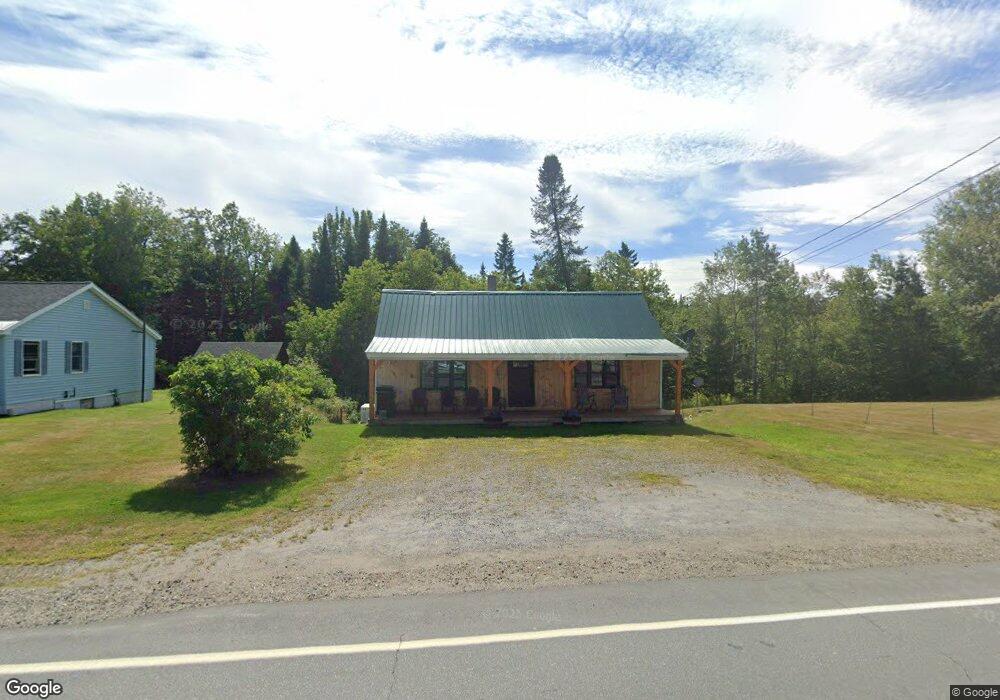
1546 Main St Pittsburg, NH 03592
Estimated Value: $211,000 - $314,000
2
Beds
2
Baths
2,133
Sq Ft
$119/Sq Ft
Est. Value
About This Home
This home is located at 1546 Main St, Pittsburg, NH 03592 and is currently estimated at $253,220, approximately $118 per square foot. 1546 Main St is a home located in Coos County with nearby schools including Pittsburg Elementary/Middle School and Pittsburg High School.
Ownership History
Date
Name
Owned For
Owner Type
Purchase Details
Closed on
Oct 9, 2015
Sold by
Ansart Ronald P and Bank Of America Na
Bought by
Fnma
Current Estimated Value
Purchase Details
Closed on
Nov 8, 2005
Sold by
Parker David
Bought by
Ansart Ronald P and Ansart Laurie A
Home Financials for this Owner
Home Financials are based on the most recent Mortgage that was taken out on this home.
Original Mortgage
$45,000
Interest Rate
5.85%
Create a Home Valuation Report for This Property
The Home Valuation Report is an in-depth analysis detailing your home's value as well as a comparison with similar homes in the area
Home Values in the Area
Average Home Value in this Area
Purchase History
| Date | Buyer | Sale Price | Title Company |
|---|---|---|---|
| Fnma | $18,796 | -- | |
| Ansart Ronald P | $50,000 | -- |
Source: Public Records
Mortgage History
| Date | Status | Borrower | Loan Amount |
|---|---|---|---|
| Previous Owner | Ansart Ronald P | $84,000 | |
| Previous Owner | Ansart Ronald P | $65,800 | |
| Previous Owner | Ansart Ronald P | $45,000 |
Source: Public Records
Tax History Compared to Growth
Tax History
| Year | Tax Paid | Tax Assessment Tax Assessment Total Assessment is a certain percentage of the fair market value that is determined by local assessors to be the total taxable value of land and additions on the property. | Land | Improvement |
|---|---|---|---|---|
| 2024 | $1,976 | $205,800 | $70,400 | $135,400 |
| 2023 | $1,983 | $206,600 | $70,400 | $136,200 |
| 2022 | $1,332 | $83,800 | $17,800 | $66,000 |
| 2021 | $1,304 | $83,800 | $17,800 | $66,000 |
| 2020 | $786 | $49,900 | $17,800 | $32,100 |
| 2019 | $798 | $49,900 | $17,800 | $32,100 |
| 2018 | $1,199 | $79,000 | $17,800 | $61,200 |
| 2016 | $1,371 | $87,300 | $8,700 | $78,600 |
| 2015 | $1,423 | $87,300 | $8,700 | $78,600 |
| 2014 | $1,506 | $87,300 | $8,700 | $78,600 |
| 2013 | $1,458 | $87,300 | $8,700 | $78,600 |
Source: Public Records
Map
Nearby Homes