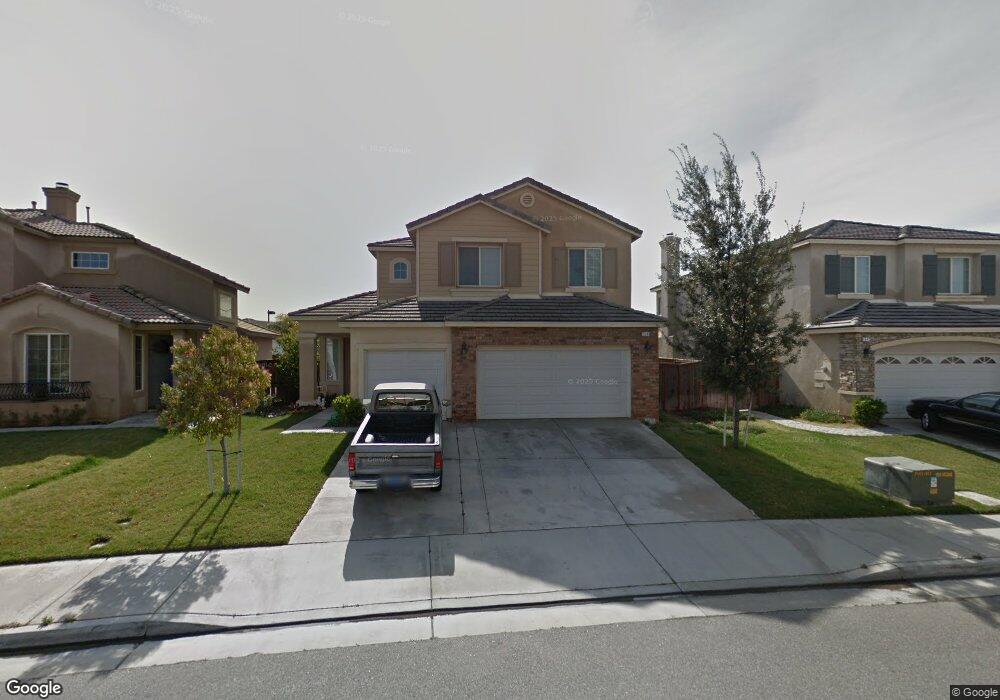
1546 Shadow Hill Trail Beaumont, CA 92223
Estimated Value: $545,216 - $569,000
4
Beds
4
Baths
2,423
Sq Ft
$230/Sq Ft
Est. Value
About This Home
This home is located at 1546 Shadow Hill Trail, Beaumont, CA 92223 and is currently estimated at $558,304, approximately $230 per square foot. 1546 Shadow Hill Trail is a home located in Riverside County with nearby schools including Anna Hause Elementary School, San Gorgonio Middle School, and Beaumont Senior High School.
Ownership History
Date
Name
Owned For
Owner Type
Purchase Details
Closed on
Aug 26, 2010
Sold by
Federal National Mortgage Association
Bought by
Chavez Jose L and Chavez Sara
Current Estimated Value
Home Financials for this Owner
Home Financials are based on the most recent Mortgage that was taken out on this home.
Original Mortgage
$177,608
Outstanding Balance
$116,743
Interest Rate
4.35%
Mortgage Type
FHA
Estimated Equity
$441,561
Purchase Details
Closed on
Mar 8, 2010
Sold by
Tran Tien Minh and Nguyen Bach Yen
Bought by
Federal National Mortgage Association
Purchase Details
Closed on
Apr 30, 2008
Sold by
Nguyen Bach Yen
Bought by
Tran Tien Minh
Purchase Details
Closed on
Jul 8, 2005
Sold by
Silver Oaks Beaumont 72 Llc
Bought by
Tran Tien Minh and Nguyen Bach Yen
Home Financials for this Owner
Home Financials are based on the most recent Mortgage that was taken out on this home.
Original Mortgage
$321,600
Interest Rate
6.37%
Mortgage Type
Purchase Money Mortgage
Create a Home Valuation Report for This Property
The Home Valuation Report is an in-depth analysis detailing your home's value as well as a comparison with similar homes in the area
Home Values in the Area
Average Home Value in this Area
Purchase History
| Date | Buyer | Sale Price | Title Company |
|---|---|---|---|
| Chavez Jose L | $180,000 | First American Title Company | |
| Federal National Mortgage Association | $365,072 | Accommodation | |
| Tran Tien Minh | -- | None Available | |
| Tran Tien Minh | $402,000 | Fidelity National Title Buil |
Source: Public Records
Mortgage History
| Date | Status | Borrower | Loan Amount |
|---|---|---|---|
| Open | Chavez Jose L | $177,608 | |
| Previous Owner | Tran Tien Minh | $321,600 |
Source: Public Records
Tax History Compared to Growth
Tax History
| Year | Tax Paid | Tax Assessment Tax Assessment Total Assessment is a certain percentage of the fair market value that is determined by local assessors to be the total taxable value of land and additions on the property. | Land | Improvement |
|---|---|---|---|---|
| 2025 | $4,388 | $230,600 | $57,647 | $172,953 |
| 2023 | $4,388 | $221,647 | $55,409 | $166,238 |
| 2022 | $4,310 | $217,302 | $54,323 | $162,979 |
| 2021 | $4,226 | $213,042 | $53,258 | $159,784 |
| 2020 | $4,209 | $210,858 | $52,712 | $158,146 |
| 2019 | $4,096 | $206,725 | $51,679 | $155,046 |
| 2018 | $4,307 | $202,672 | $50,667 | $152,005 |
| 2017 | $4,704 | $198,699 | $49,674 | $149,025 |
| 2016 | $4,838 | $194,803 | $48,700 | $146,103 |
| 2015 | $4,753 | $191,878 | $47,969 | $143,909 |
| 2014 | $4,747 | $188,121 | $47,030 | $141,091 |
Source: Public Records
Map
Nearby Homes
- 1595 Mountain View Trail
- 687 Cedar View Dr
- 1601 Stone Creek Rd
- 1626 Stone Creek Rd
- 717 Lions Lair Rd
- 1385 Palm Ave
- 1657 Stone Creek Rd
- 1679 Stone Creek Rd
- 1139 Desert Fox Ct
- 1115 Brown Bear Trail
- 1123 Brown Bear Trail
- 645 Bryce Ln
- 1172 Cedar Hollow Rd
- 1425 Cherry Ave
- 601 Cypress St
- 11345 Sunnyslope Ave
- 1292 N California Ave
- 1216 Beaumont Ave
- 11285 Cherry Ave
- 728 Indigo St
- 1546 Shadow Hills Trail
- 1542 Shadow Hill Trail
- 1552 Shadow Hill Trail
- 1538 Shadow Hills Trail
- 1538 Shadow Hill Trail
- 1558 Shadow Hill Trail
- 1545 Shadow Hill Trail
- 1526 Shadow Hills Trail
- 1526 Shadow Hill Trail
- 1539 Shadow Hills Trail
- 1553 Shadow Hill Trail
- 546 Heidi Cir
- 1560 Shadow Hill Trail
- 523 Heidi Cir
- 1563 Shadow Hills Trail
- 1563 Shadow Hill Trail
- 533 Heidi Cir
- 1520 Shadow Hills Trail
- 1536 Mountain View Trail
- 1538 Mountain View Trail